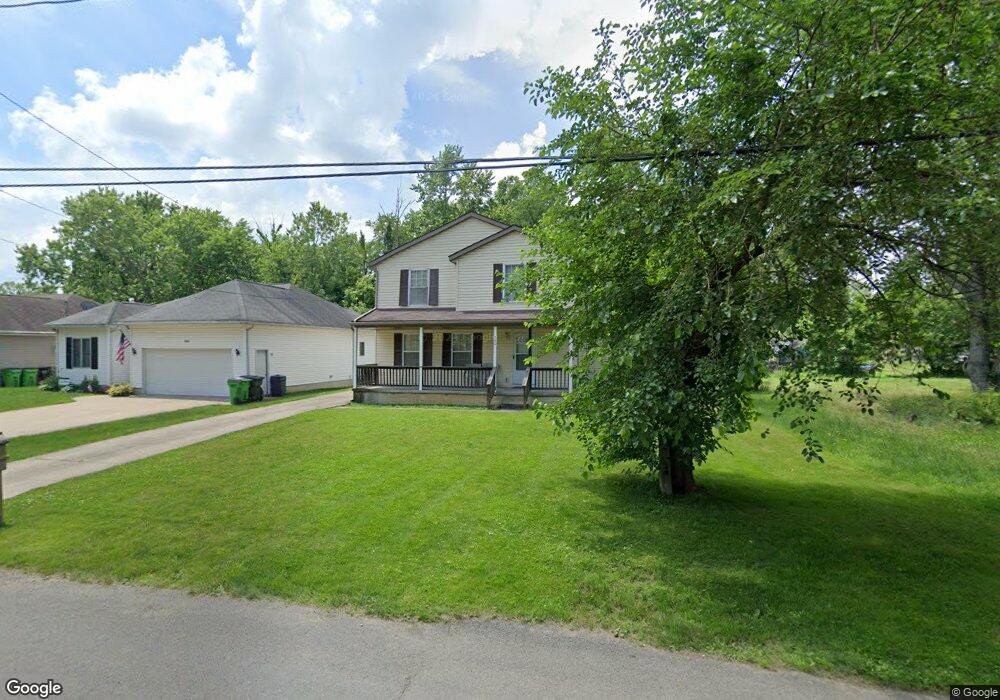
380 Bell St Barberton, OH 44203
East Barberton NeighborhoodEstimated Value: $151,000 - $208,000
3
Beds
2
Baths
1,372
Sq Ft
$135/Sq Ft
Est. Value
About This Home
This home is located at 380 Bell St, Barberton, OH 44203 and is currently estimated at $184,619, approximately $134 per square foot. 380 Bell St is a home located in Summit County with nearby schools including Barberton Middle School, Barberton High School, and St. Francis de Sales School.
Ownership History
Date
Name
Owned For
Owner Type
Purchase Details
Closed on
Mar 2, 2017
Sold by
Herrin Selimna D
Bought by
Herrin Mitchell
Current Estimated Value
Purchase Details
Closed on
Sep 30, 2005
Sold by
Evergreen Homes Llc
Bought by
Herrin Selina D and Herrin Mitchell
Home Financials for this Owner
Home Financials are based on the most recent Mortgage that was taken out on this home.
Original Mortgage
$111,920
Outstanding Balance
$64,752
Interest Rate
7.07%
Mortgage Type
Fannie Mae Freddie Mac
Estimated Equity
$119,867
Purchase Details
Closed on
Oct 27, 2004
Sold by
Northern Builders Inc
Bought by
Evergreen Homes Llc
Purchase Details
Closed on
Aug 27, 2000
Sold by
Clark Charles W and Clark Lisa M
Bought by
Northern Builders Inc
Purchase Details
Closed on
Mar 19, 1998
Sold by
Clark Gertrude M
Bought by
Clark Charles W and Clark Lisa M
Create a Home Valuation Report for This Property
The Home Valuation Report is an in-depth analysis detailing your home's value as well as a comparison with similar homes in the area
Home Values in the Area
Average Home Value in this Area
Purchase History
| Date | Buyer | Sale Price | Title Company |
|---|---|---|---|
| Herrin Mitchell | -- | None Available | |
| Herrin Selina D | $139,900 | First Security Title Corpora | |
| Evergreen Homes Llc | $7,500 | Bond & Associates Title Agen | |
| Northern Builders Inc | $18,000 | Miller Examining Service Inc | |
| Clark Charles W | $1,000 | -- |
Source: Public Records
Mortgage History
| Date | Status | Borrower | Loan Amount |
|---|---|---|---|
| Open | Herrin Selina D | $111,920 |
Source: Public Records
Tax History Compared to Growth
Tax History
| Year | Tax Paid | Tax Assessment Tax Assessment Total Assessment is a certain percentage of the fair market value that is determined by local assessors to be the total taxable value of land and additions on the property. | Land | Improvement |
|---|---|---|---|---|
| 2025 | $2,196 | $43,939 | $7,357 | $36,582 |
| 2024 | $2,196 | $43,939 | $7,357 | $36,582 |
| 2023 | $2,196 | $43,939 | $7,357 | $36,582 |
| 2022 | $1,758 | $30,513 | $5,110 | $25,403 |
| 2021 | $1,756 | $30,513 | $5,110 | $25,403 |
| 2020 | $1,719 | $30,510 | $5,110 | $25,400 |
| 2019 | $1,939 | $31,180 | $4,600 | $26,580 |
| 2018 | $1,910 | $31,180 | $4,600 | $26,580 |
| 2017 | $1,758 | $31,180 | $4,600 | $26,580 |
| 2016 | $1,762 | $28,330 | $4,600 | $23,730 |
| 2015 | $1,758 | $28,330 | $4,600 | $23,730 |
| 2014 | $1,749 | $28,330 | $4,600 | $23,730 |
| 2013 | $1,716 | $28,830 | $4,600 | $24,230 |
Source: Public Records
Map
Nearby Homes
- 43 S Van Buren Ave
- 25 S Van Buren Ave
- 64 Diamond Ave
- 311 Holly Place
- 251 Slate Ridge Dr
- 327 Robinson Ave
- 588 Austin Dr
- 6 5th St NE
- 375 Big Bend Cir
- 369 Big Bend Cir
- 477 Robinson Ave
- 414 E Baird Ave
- 1110 Mansion Dr
- 673 Wooster Rd W
- 679 Wooster Rd W
- 357 E Paige Ave
- V/L Bishop Oval
- 1742 Turkeyfoot Lake Rd
- 2457 Bishop Oval
- 349 E Hopocan Ave
- 384 Bell St
- 390 Bell St
- 366 Bell St
- 366 Bell St
- 375 S Van Buren Ave
- 381 Bell St
- 358 Bell St
- 375 Bell St
- 385 Bell St
- 371 S Van Buren Ave
- 369 Bell St
- 379 S Van Buren Ave
- 385 S Van Buren Ave
- 359 Bell St
- 391 S Van Buren Ave
- 395 S Van Buren Ave
- 355 S Van Buren Ave
- 225 Stanley Ave
- 359 S Van Buren Ave
- 355 Bell St