Estimated Value: $229,000 - $273,000
3
Beds
1
Bath
1,008
Sq Ft
$239/Sq Ft
Est. Value
About This Home
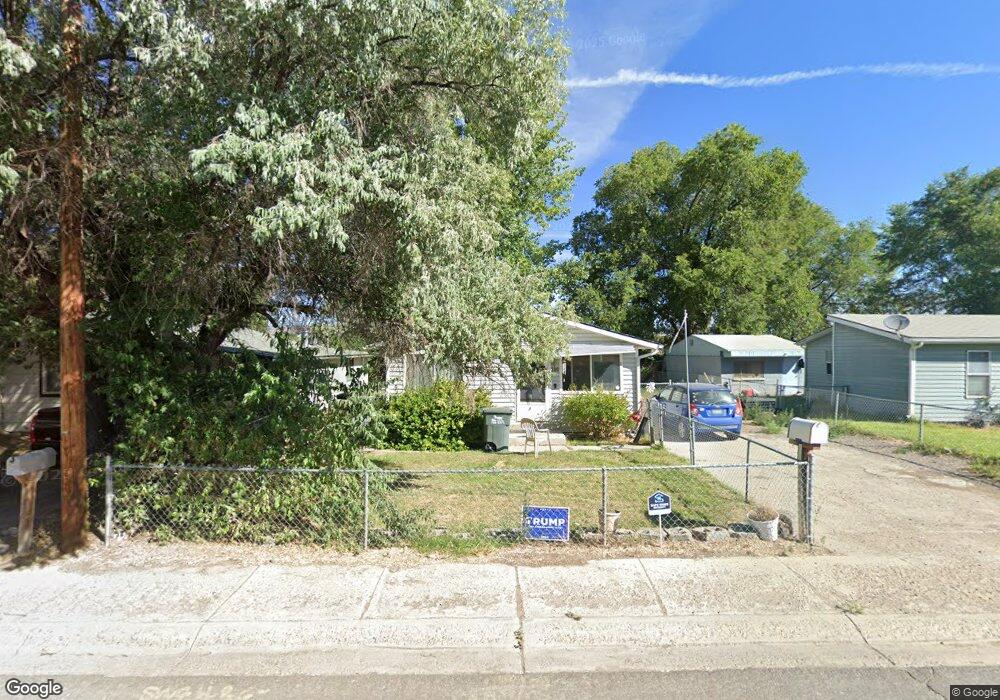
This home is located at 380 Bullion Rd, Elko, NV 89801 and is currently estimated at $241,099, approximately $239 per square foot. 380 Bullion Rd is a home located in Elko County with nearby schools including Southside Elementary School, Flagview Intermediate School, and Adobe Middle School.
Ownership History
Date
Name
Owned For
Owner Type
Purchase Details
Closed on
Oct 25, 2010
Sold by
Marzano David C
Bought by
Howard Erlean
Current Estimated Value
Home Financials for this Owner
Home Financials are based on the most recent Mortgage that was taken out on this home.
Original Mortgage
$142,415
Outstanding Balance
$101,474
Interest Rate
4.27%
Mortgage Type
Purchase Money Mortgage
Estimated Equity
$139,625
Purchase Details
Closed on
Nov 16, 2005
Sold by
Marzano David
Bought by
Marzano Sherri
Home Financials for this Owner
Home Financials are based on the most recent Mortgage that was taken out on this home.
Original Mortgage
$76,000
Interest Rate
6.37%
Mortgage Type
Adjustable Rate Mortgage/ARM
Purchase Details
Closed on
Oct 14, 2005
Sold by
Wilkins Mardell L and Sallee Mardell L
Bought by
Marzano Sherri B
Home Financials for this Owner
Home Financials are based on the most recent Mortgage that was taken out on this home.
Original Mortgage
$76,000
Interest Rate
6.37%
Mortgage Type
Adjustable Rate Mortgage/ARM
Create a Home Valuation Report for This Property
The Home Valuation Report is an in-depth analysis detailing your home's value as well as a comparison with similar homes in the area
Home Values in the Area
Average Home Value in this Area
Purchase History
| Date | Buyer | Sale Price | Title Company |
|---|---|---|---|
| Howard Erlean | $156,500 | Stewart Title Elko | |
| Marzano Sherri | -- | Stewart Title | |
| Marzano Sherri B | $95,000 | Stewart Title |
Source: Public Records
Mortgage History
| Date | Status | Borrower | Loan Amount |
|---|---|---|---|
| Open | Howard Erlean | $142,415 | |
| Previous Owner | Marzano Sherri B | $76,000 |
Source: Public Records
Tax History Compared to Growth
Tax History
| Year | Tax Paid | Tax Assessment Tax Assessment Total Assessment is a certain percentage of the fair market value that is determined by local assessors to be the total taxable value of land and additions on the property. | Land | Improvement |
|---|---|---|---|---|
| 2025 | $707 | $28,632 | $15,925 | $12,707 |
| 2024 | $707 | $20,250 | $7,525 | $12,725 |
| 2023 | $647 | $19,208 | $7,525 | $11,683 |
| 2022 | $629 | $17,120 | $7,525 | $9,595 |
| 2021 | $633 | $17,244 | $7,525 | $9,719 |
| 2020 | $617 | $17,670 | $7,525 | $10,145 |
| 2019 | $611 | $17,514 | $7,525 | $9,989 |
| 2018 | $623 | $17,854 | $7,525 | $10,329 |
| 2017 | $627 | $17,971 | $7,525 | $10,446 |
| 2016 | $640 | $18,318 | $7,525 | $10,793 |
| 2015 | $638 | $18,371 | $7,525 | $10,846 |
| 2014 | $641 | $18,115 | $7,525 | $10,590 |
Source: Public Records
Map
Nearby Homes