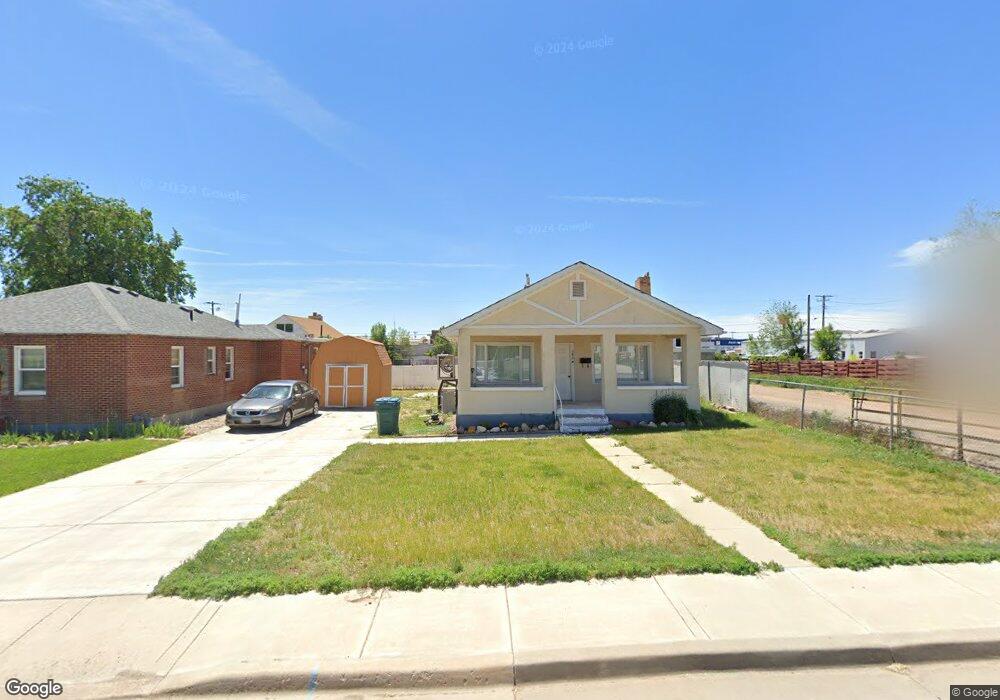
380 E 100 N Vernal, UT 84078
Estimated Value: $181,000 - $242,000
2
Beds
1
Bath
995
Sq Ft
$219/Sq Ft
Est. Value
About This Home
This home is located at 380 E 100 N, Vernal, UT 84078 and is currently estimated at $217,654, approximately $218 per square foot. 380 E 100 N is a home located in Uintah County with nearby schools including Naples School, Vernal Middle School, and Uintah Middle School.
Ownership History
Date
Name
Owned For
Owner Type
Purchase Details
Closed on
Feb 17, 2011
Sold by
Federal National Mortgage Association
Bought by
Cunningham Allison
Current Estimated Value
Purchase Details
Closed on
Aug 13, 2010
Sold by
Obrien Kurt and Nationwide Advantage Mortgage
Bought by
Federal National Mortgage Association
Purchase Details
Closed on
Sep 7, 2007
Sold by
Smith Cody Ray
Bought by
Obrien Kurt
Home Financials for this Owner
Home Financials are based on the most recent Mortgage that was taken out on this home.
Original Mortgage
$137,500
Interest Rate
6.67%
Mortgage Type
New Conventional
Purchase Details
Closed on
Oct 27, 2006
Sold by
Dalton Dennis B
Bought by
Smith Cody Ray
Home Financials for this Owner
Home Financials are based on the most recent Mortgage that was taken out on this home.
Original Mortgage
$130,000
Interest Rate
6.39%
Mortgage Type
New Conventional
Purchase Details
Closed on
Sep 20, 2005
Sold by
Dalton Leanne M
Bought by
Dalton Dennis B
Create a Home Valuation Report for This Property
The Home Valuation Report is an in-depth analysis detailing your home's value as well as a comparison with similar homes in the area
Purchase History
| Date | Buyer | Sale Price | Title Company |
|---|---|---|---|
| Cunningham Allison | -- | -- | |
| Federal National Mortgage Association | -- | -- | |
| Obrien Kurt | -- | -- | |
| Smith Cody Ray | -- | -- | |
| Dalton Dennis B | -- | -- |
Source: Public Records
Mortgage History
| Date | Status | Borrower | Loan Amount |
|---|---|---|---|
| Previous Owner | Obrien Kurt | $137,500 | |
| Previous Owner | Smith Cody Ray | $130,000 |
Source: Public Records
Tax History
| Year | Tax Paid | Tax Assessment Tax Assessment Total Assessment is a certain percentage of the fair market value that is determined by local assessors to be the total taxable value of land and additions on the property. | Land | Improvement |
|---|---|---|---|---|
| 2024 | $818 | $91,473 | $13,575 | $77,898 |
| 2023 | $806 | $79,531 | $13,863 | $65,668 |
| 2022 | $717 | $66,397 | $13,863 | $52,534 |
| 2021 | $740 | $56,574 | $13,863 | $42,711 |
| 2020 | $709 | $55,736 | $13,863 | $41,873 |
| 2019 | $803 | $62,334 | $16,500 | $45,834 |
| 2018 | $776 | $60,152 | $16,500 | $43,652 |
| 2017 | $8 | $62,902 | $19,250 | $43,652 |
| 2016 | $811 | $69,252 | $19,250 | $50,002 |
| 2015 | $749 | $69,252 | $19,250 | $50,002 |
| 2014 | $681 | $63,752 | $13,750 | $50,002 |
| 2013 | $695 | $63,752 | $13,750 | $50,002 |
Source: Public Records
Map
Nearby Homes
- 190 N 500 E Unit A202
- 190 N 500 E Unit A101
- 190 N 500 E Unit A206
- 190 N 500 E Unit A406
- 190 N 500 E Unit A304
- 190 N 500 E Unit A403
- 190 N 500 E Unit A301
- 190 N 500 E Unit A105
- 561 E 250 N
- 235 S 100 E
- 117 W 100 S
- 576 E 600 N Unit 4
- 535 E 600 N
- 170 W 200 S
- 609 E 600 N
- 422 E 500 S Unit C
- 119 W 500 N
- 384 E 535 S
- 209 W 200 S
- 277 E 700 N
Your Personal Tour Guide
Ask me questions while you tour the home.