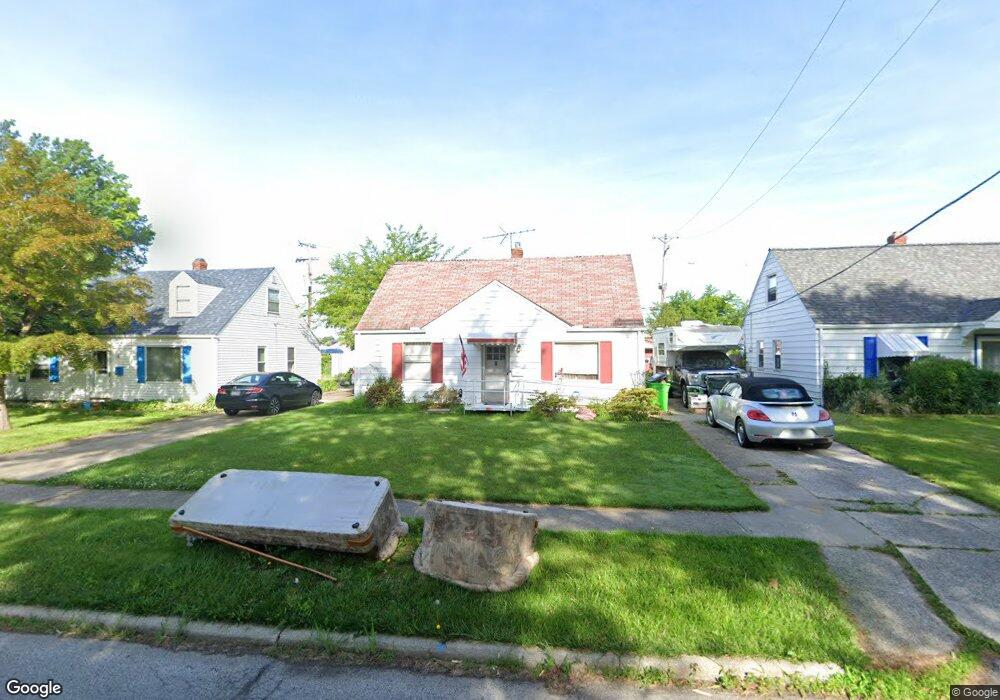
380 E 232nd St Euclid, OH 44123
Estimated Value: $130,449
4
Beds
1
Bath
1,222
Sq Ft
$107/Sq Ft
Est. Value
About This Home
This home is located at 380 E 232nd St, Euclid, OH 44123 and is currently priced at $130,449, approximately $106 per square foot. 380 E 232nd St is a home located in Cuyahoga County with nearby schools including Bluestone Elementary School, Euclid High School, and Pinnacle Academy.
Ownership History
Date
Name
Owned For
Owner Type
Purchase Details
Closed on
May 30, 2024
Sold by
Er Inv Llc
Bought by
Bh Group Life Ny Llc
Current Estimated Value
Purchase Details
Closed on
Jul 11, 2023
Sold by
Sheriff Of Cuyahoga County
Bought by
Er Inv Llc
Purchase Details
Closed on
Mar 4, 2007
Sold by
Mccarthy Brian A and Mccarthy Elaine E
Bought by
Bleigh Jeffrey W
Home Financials for this Owner
Home Financials are based on the most recent Mortgage that was taken out on this home.
Original Mortgage
$69,900
Interest Rate
6.27%
Mortgage Type
VA
Purchase Details
Closed on
Sep 23, 1997
Sold by
Braun Helen A
Bought by
Mccarthy Brian A and Mccarthy Elaine E
Home Financials for this Owner
Home Financials are based on the most recent Mortgage that was taken out on this home.
Original Mortgage
$57,900
Interest Rate
7.55%
Mortgage Type
FHA
Purchase Details
Closed on
Jan 1, 1975
Bought by
Wuescher Theresa
Create a Home Valuation Report for This Property
The Home Valuation Report is an in-depth analysis detailing your home's value as well as a comparison with similar homes in the area
Home Values in the Area
Average Home Value in this Area
Purchase History
| Date | Buyer | Sale Price | Title Company |
|---|---|---|---|
| Bh Group Life Ny Llc | $132,000 | Hampton Title | |
| Er Inv Llc | $46,700 | None Listed On Document | |
| Bleigh Jeffrey W | $69,900 | Landamerica | |
| Mccarthy Brian A | $58,000 | -- | |
| Wuescher Theresa | -- | -- |
Source: Public Records
Mortgage History
| Date | Status | Borrower | Loan Amount |
|---|---|---|---|
| Previous Owner | Bleigh Jeffrey W | $69,900 | |
| Previous Owner | Mccarthy Brian A | $57,900 |
Source: Public Records
Tax History
| Year | Tax Paid | Tax Assessment Tax Assessment Total Assessment is a certain percentage of the fair market value that is determined by local assessors to be the total taxable value of land and additions on the property. | Land | Improvement |
|---|---|---|---|---|
| 2024 | $2,805 | $39,795 | $8,470 | $31,325 |
| 2023 | $2,358 | $26,460 | $6,160 | $20,300 |
| 2022 | $2,458 | $26,460 | $6,160 | $20,300 |
| 2021 | $2,571 | $26,460 | $6,160 | $20,300 |
| 2020 | $2,610 | $24,500 | $5,710 | $18,800 |
| 2019 | $2,350 | $70,000 | $16,300 | $53,700 |
| 2018 | $2,373 | $24,500 | $5,710 | $18,800 |
| 2017 | $2,499 | $21,560 | $5,600 | $15,960 |
| 2016 | $2,505 | $21,560 | $5,600 | $15,960 |
| 2015 | $2,285 | $21,560 | $5,600 | $15,960 |
| 2014 | $2,285 | $21,560 | $5,600 | $15,960 |
Source: Public Records
Map
Nearby Homes
- 23198 Gay St
- 324 E 235th St
- 323 E 235th St
- 334 E 238th St
- 461 Kenwood Dr Unit T3
- 303 E 235th St
- 470 Kenwood Dr Unit D
- 521 Kenwood Dr Unit B-5
- 450 Kenwood Dr Unit D-12
- 450 Kenwood Dr Unit E12
- 490 Kenwood Dr Unit B
- 22751 Fox Ave
- 170 E 220th St
- 421 Kenwood Dr Unit G
- 422 Clearview Dr Unit J10
- 244 E 238th St
- 24181 Devoe Ave
- 55 Sunnycliff Dr
- 104 E 219th St
- 226 E 216th St
Your Personal Tour Guide
Ask me questions while you tour the home.