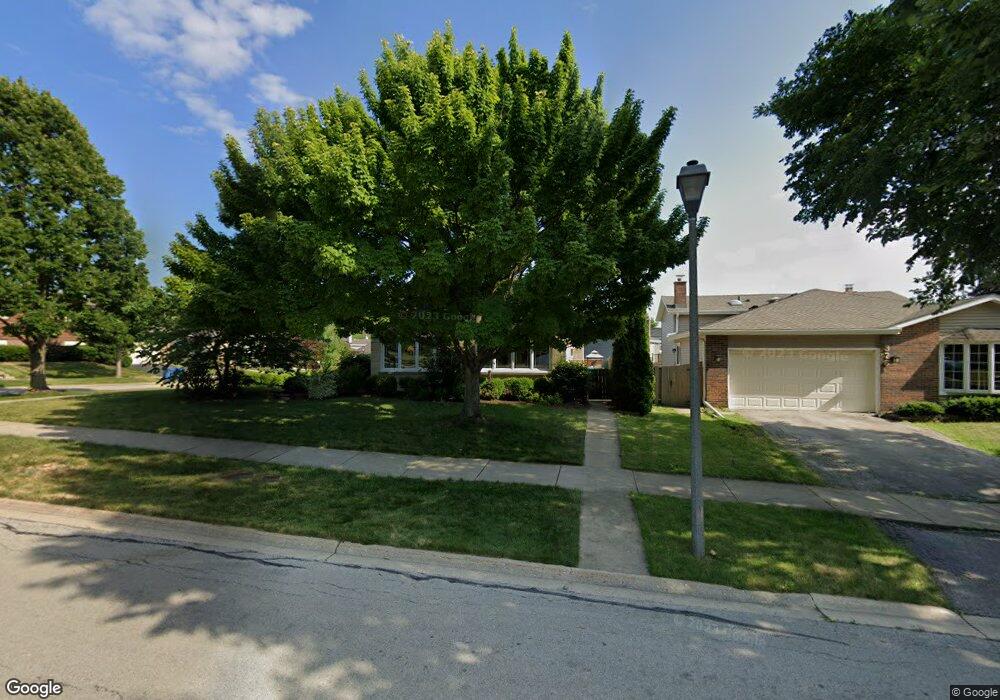
380 E Yorkfield Ave Elmhurst, IL 60126
Estimated Value: $522,000 - $658,000
Studio
--
Bath
1,403
Sq Ft
$419/Sq Ft
Est. Value
About This Home
This home is located at 380 E Yorkfield Ave, Elmhurst, IL 60126 and is currently estimated at $587,549, approximately $418 per square foot. 380 E Yorkfield Ave is a home located in DuPage County with nearby schools including Edison Elementary School, Bryan Middle School, and York Community High School.
Ownership History
Date
Name
Owned For
Owner Type
Purchase Details
Closed on
May 4, 2004
Sold by
Prigg Cheryl L
Bought by
Prigg Jason D
Current Estimated Value
Home Financials for this Owner
Home Financials are based on the most recent Mortgage that was taken out on this home.
Original Mortgage
$323,000
Outstanding Balance
$162,004
Interest Rate
6.5%
Mortgage Type
Stand Alone Refi Refinance Of Original Loan
Estimated Equity
$425,545
Purchase Details
Closed on
Dec 19, 2001
Sold by
Prigg Jason D and Prigg Cheryl L
Bought by
Prigg Cheryl L
Purchase Details
Closed on
Sep 13, 1995
Sold by
Bridgman Denise H and Bridgman Shel W
Bought by
Prigg Jason D and Prigg Cheryl L
Home Financials for this Owner
Home Financials are based on the most recent Mortgage that was taken out on this home.
Original Mortgage
$214,700
Interest Rate
7.91%
Create a Home Valuation Report for This Property
The Home Valuation Report is an in-depth analysis detailing your home's value as well as a comparison with similar homes in the area
Home Values in the Area
Average Home Value in this Area
Purchase History
| Date | Buyer | Sale Price | Title Company |
|---|---|---|---|
| Prigg Jason D | -- | Ticor Title | |
| Prigg Cheryl L | -- | Chicago Title Insurance Co | |
| Prigg Jason D | $226,000 | -- |
Source: Public Records
Mortgage History
| Date | Status | Borrower | Loan Amount |
|---|---|---|---|
| Open | Prigg Jason D | $323,000 | |
| Closed | Prigg Jason D | $214,700 |
Source: Public Records
Tax History
| Year | Tax Paid | Tax Assessment Tax Assessment Total Assessment is a certain percentage of the fair market value that is determined by local assessors to be the total taxable value of land and additions on the property. | Land | Improvement |
|---|---|---|---|---|
| 2024 | $9,586 | $167,055 | $91,714 | $75,341 |
| 2023 | $8,893 | $154,480 | $84,810 | $69,670 |
| 2022 | $8,641 | $148,500 | $81,530 | $66,970 |
| 2021 | $8,425 | $144,800 | $79,500 | $65,300 |
| 2020 | $8,098 | $141,630 | $77,760 | $63,870 |
| 2019 | $7,924 | $134,650 | $73,930 | $60,720 |
| 2018 | $7,423 | $125,820 | $69,980 | $55,840 |
| 2017 | $7,257 | $119,900 | $66,690 | $53,210 |
| 2016 | $7,100 | $112,960 | $62,830 | $50,130 |
| 2015 | $7,023 | $105,230 | $58,530 | $46,700 |
| 2014 | $6,987 | $96,670 | $46,450 | $50,220 |
| 2013 | $6,913 | $98,030 | $47,100 | $50,930 |
Source: Public Records
Map
Nearby Homes
- 323 E Butterfield Rd
- 15W320 Concord St
- 956 S Cadwell Ave
- 918 S Cambridge Ave
- 522 E Park Manor Ct
- 837 S Kearsage Ave
- 788 S Cambridge Ave
- 494 E Atwood Ct
- 2050 Atwood Ave
- 857 S Euclid Ave
- 274 E Crescent Ave
- 101 W Jackson St
- 593 S Edgewood Ave
- 110 W Butterfield Rd Unit 502S
- 160 E Cayuga Ave
- 566 S Cedar Ave
- 881 S Bryan St
- 580 S Kearsage Ave
- 878 S Parkside Ave
- 250 N Irving Ave
- 376 E Yorkfield Ave
- 940 S Fern Ave
- 372 E Yorkfield Ave
- 390 E Yorkfield Ave
- 368 E Yorkfield Ave
- 935 S Fern Ave
- 394 E Yorkfield Ave
- 939 S Fern Ave
- 377 E Yorkfield Ave
- 948 S Fern Ave
- 382 E Butterfield Rd
- 373 E Yorkfield Ave
- 364 E Yorkfield Ave
- 943 S Fern Ave
- 400 E Yorkfield Ave
- 369 E Yorkfield Ave
- 945 S Linden Ave
- 947 S Fern Ave
- 389 E Yorkfield Ave
- 954 S Fern Ave
Your Personal Tour Guide
Ask me questions while you tour the home.