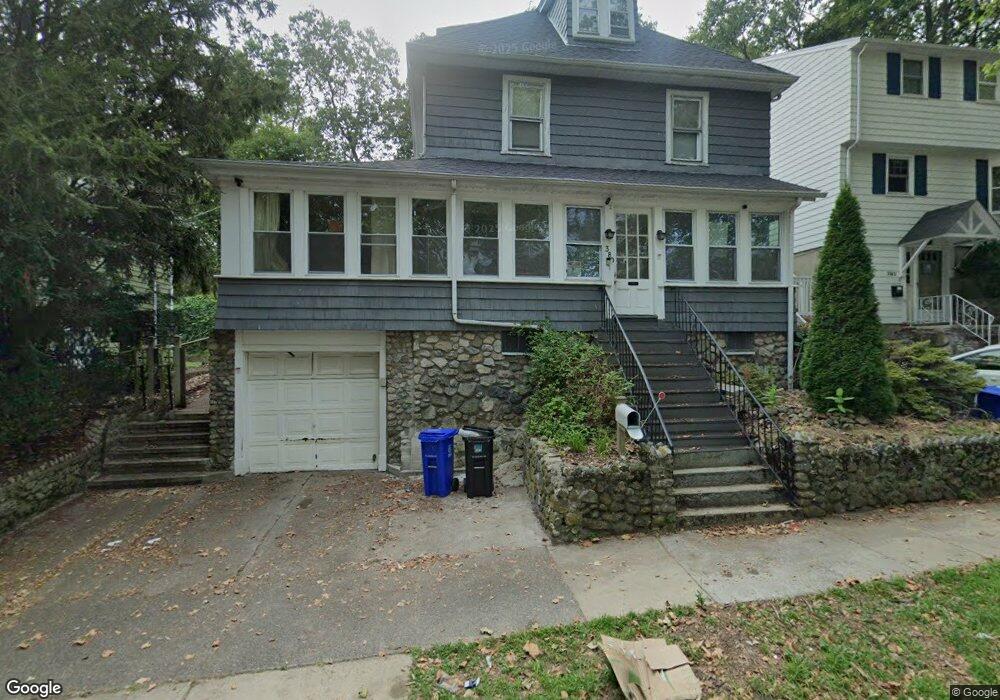
380 Fellsway E Malden, MA 02148
Upper Highlands NeighborhoodEstimated Value: $723,950 - $855,000
4
Beds
1
Bath
1,521
Sq Ft
$513/Sq Ft
Est. Value
About This Home
This home is located at 380 Fellsway E, Malden, MA 02148 and is currently estimated at $780,238, approximately $512 per square foot. 380 Fellsway E is a home located in Middlesex County with nearby schools including Malden High School, Mystic Valley Regional Charter School, and Cheverus Catholic School.
Ownership History
Date
Name
Owned For
Owner Type
Purchase Details
Closed on
Nov 10, 2009
Sold by
Est Paolini Frances C and Kevill John F
Bought by
Lei Zhen Yi and Yun-Lei Karen Shi
Current Estimated Value
Home Financials for this Owner
Home Financials are based on the most recent Mortgage that was taken out on this home.
Original Mortgage
$196,500
Outstanding Balance
$128,700
Interest Rate
5.06%
Mortgage Type
Purchase Money Mortgage
Estimated Equity
$651,538
Purchase Details
Closed on
May 7, 2004
Sold by
Kevill Mary H
Bought by
Paolini Frances C and Kevill Mary H
Create a Home Valuation Report for This Property
The Home Valuation Report is an in-depth analysis detailing your home's value as well as a comparison with similar homes in the area
Home Values in the Area
Average Home Value in this Area
Purchase History
| Date | Buyer | Sale Price | Title Company |
|---|---|---|---|
| Lei Zhen Yi | $262,000 | -- | |
| Paolini Frances C | -- | -- |
Source: Public Records
Mortgage History
| Date | Status | Borrower | Loan Amount |
|---|---|---|---|
| Open | Lei Zhen Yi | $196,500 |
Source: Public Records
Tax History Compared to Growth
Tax History
| Year | Tax Paid | Tax Assessment Tax Assessment Total Assessment is a certain percentage of the fair market value that is determined by local assessors to be the total taxable value of land and additions on the property. | Land | Improvement |
|---|---|---|---|---|
| 2025 | $65 | $575,600 | $271,600 | $304,000 |
| 2024 | $6,066 | $518,900 | $252,500 | $266,400 |
| 2023 | $5,951 | $488,200 | $229,800 | $258,400 |
| 2022 | $5,728 | $463,800 | $212,400 | $251,400 |
| 2021 | $5,457 | $444,000 | $199,500 | $244,500 |
| 2020 | $5,304 | $419,300 | $190,100 | $229,200 |
| 2019 | $5,244 | $395,200 | $181,100 | $214,100 |
| 2018 | $4,886 | $346,800 | $141,000 | $205,800 |
| 2017 | $4,775 | $337,000 | $141,000 | $196,000 |
| 2016 | $4,597 | $303,200 | $125,400 | $177,800 |
| 2015 | $4,494 | $285,700 | $119,100 | $166,600 |
| 2014 | $4,505 | $279,800 | $119,100 | $160,700 |
Source: Public Records
Map
Nearby Homes
- 311-313 Clifton St
- 124 Bower St
- 11 Girard Rd
- 33 Prospect St
- 49 Doonan St
- 63 Doonan St
- 8 Cliffside Terrace
- 108 Maple St Unit 6
- 87 Cedar St Unit 10
- 1 Dexter St Unit 5
- 12 Victor St
- 426 Pleasant St Unit 17
- 426 Pleasant St Unit 2
- 20 Rockland Ave Unit 3
- 394 Pleasant St Unit 396
- 53 Maple St
- 20 Chestnut St Unit 205
- 89 Horne Ave
- 38 Greystone Rd
- 368 Pleasant St Unit 204