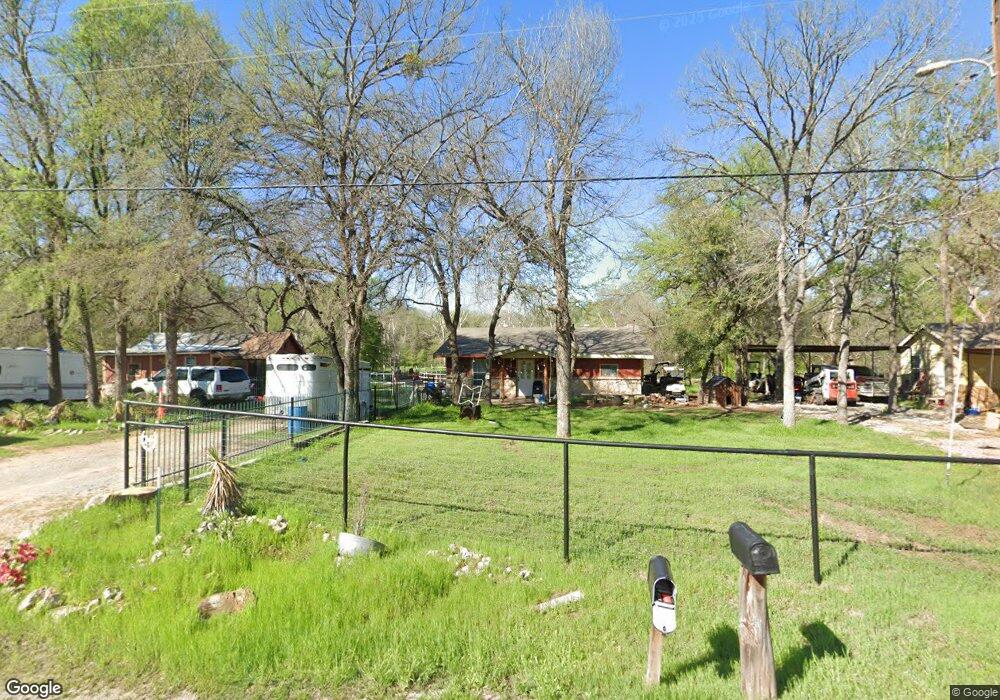
380 Lipan Trail Weatherford, TX 76087
Estimated Value: $167,285 - $372,000
2
Beds
2
Baths
1,365
Sq Ft
$181/Sq Ft
Est. Value
About This Home
This home is located at 380 Lipan Trail, Weatherford, TX 76087 and is currently estimated at $247,071, approximately $181 per square foot. 380 Lipan Trail is a home located in Parker County with nearby schools including Wright Elementary School, Hall Middle School, and Weatherford High School.
Ownership History
Date
Name
Owned For
Owner Type
Purchase Details
Closed on
May 24, 2010
Sold by
Restoration Properties Inc
Bought by
Montelongo Evaristo and Trevino Veronica
Current Estimated Value
Home Financials for this Owner
Home Financials are based on the most recent Mortgage that was taken out on this home.
Original Mortgage
$79,900
Interest Rate
4.39%
Mortgage Type
Seller Take Back
Purchase Details
Closed on
Nov 19, 2009
Sold by
Hutchinson Linda Fay
Bought by
Montelongo Evaristo and Trevino Veronica
Home Financials for this Owner
Home Financials are based on the most recent Mortgage that was taken out on this home.
Original Mortgage
$37,000
Interest Rate
4.93%
Mortgage Type
Purchase Money Mortgage
Purchase Details
Closed on
Jan 21, 1986
Bought by
Montelongo Evaristo and Trevino Veronica
Create a Home Valuation Report for This Property
The Home Valuation Report is an in-depth analysis detailing your home's value as well as a comparison with similar homes in the area
Home Values in the Area
Average Home Value in this Area
Purchase History
| Date | Buyer | Sale Price | Title Company |
|---|---|---|---|
| Montelongo Evaristo | -- | -- | |
| Montelongo Evaristo | -- | None Available | |
| Montelongo Evaristo | -- | -- | |
| Restoration Properties Inc | -- | Providence Title | |
| Montelongo Evaristo | -- | -- |
Source: Public Records
Mortgage History
| Date | Status | Borrower | Loan Amount |
|---|---|---|---|
| Previous Owner | Montelongo Evaristo | $79,900 | |
| Previous Owner | Montelongo Evaristo | $67,000 | |
| Previous Owner | Restoration Properties Inc | $37,000 |
Source: Public Records
Tax History Compared to Growth
Tax History
| Year | Tax Paid | Tax Assessment Tax Assessment Total Assessment is a certain percentage of the fair market value that is determined by local assessors to be the total taxable value of land and additions on the property. | Land | Improvement |
|---|---|---|---|---|
| 2025 | $345 | $102,770 | $20,000 | $82,770 |
| 2024 | $345 | $58,938 | -- | -- |
| 2023 | $345 | $53,580 | $0 | $0 |
| 2022 | $906 | $52,450 | $5,000 | $47,450 |
| 2021 | $892 | $52,450 | $5,000 | $47,450 |
| 2020 | $815 | $51,420 | $5,000 | $46,420 |
| 2019 | $789 | $51,420 | $5,000 | $46,420 |
| 2018 | $724 | $33,270 | $500 | $32,770 |
| 2017 | $738 | $33,270 | $500 | $32,770 |
| 2016 | $738 | $33,270 | $500 | $32,770 |
| 2015 | $354 | $33,270 | $500 | $32,770 |
| 2014 | $459 | $31,500 | $500 | $31,000 |
Source: Public Records
Map
Nearby Homes
- TBD Lipan Trail
- 231 Seminole Trail
- 7078 Apache Trail
- 218 Kickapoo Trail
- TBD Aztec
- TBD Chavez Trail
- 7077 Aztec
- 302 Chavez Trail
- 7027 Apache Trail
- Lot 4 Boeing Trail
- 172 Chavez Trail
- 1200 Red Bank Rd
- 131 Lipan Trail
- 7109 Navajo Trail
- 000 Blackfoot Trail
- TBD Blackfoot Trail
- 7114 Huron Trail
- 7021 Cimmaron Trail
- 7077 Cherokee Trail
- 7056 Cherokee Trail
- 405 Lipan Trail
- 377 Lipan Trail
- 376 Lipan Trail
- 356 Pueblo Trail
- 375 Lipan Trail
- 370 Lipan Trail
- 355 Pueblo Trail
- 7147 River Trail
- 411 Lipan Trail
- 348 Pueblo Trail
- 414 Lipan Trail
- 371 Lipan Trail
- 347 Pueblo Trail
- 362 Lipan Trail
- 415 Lipan Trail
- 416 Lipan Trail
- 337 Pueblo Trail
- TBD Pueblo Trail
- 334 Pueblo Trail
- 330 Pueblo Trail