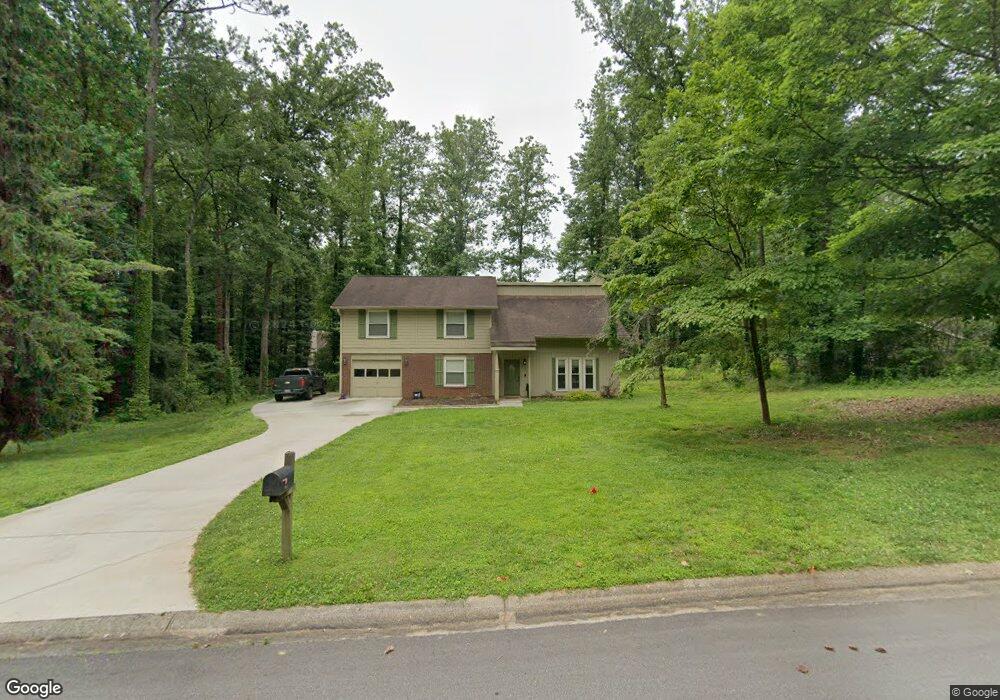
380 Longleaf Dr Roswell, GA 30075
Estimated Value: $473,000 - $546,775
4
Beds
3
Baths
1,566
Sq Ft
$320/Sq Ft
Est. Value
About This Home
This home is located at 380 Longleaf Dr, Roswell, GA 30075 and is currently estimated at $500,694, approximately $319 per square foot. 380 Longleaf Dr is a home located in Fulton County with nearby schools including Roswell North Elementary School, Crabapple Middle School, and Roswell High School.
Ownership History
Date
Name
Owned For
Owner Type
Purchase Details
Closed on
Oct 4, 2024
Sold by
Bond Robin L
Bought by
Bond Robin L Tr
Current Estimated Value
Purchase Details
Closed on
Sep 16, 2024
Sold by
Bond Robert
Bought by
Bond Robin
Purchase Details
Closed on
May 22, 2008
Sold by
Warlick E Kenneth and Warlick Mia S
Bought by
Bond Robert and Bond Robin
Home Financials for this Owner
Home Financials are based on the most recent Mortgage that was taken out on this home.
Original Mortgage
$196,910
Interest Rate
6%
Mortgage Type
FHA
Purchase Details
Closed on
Aug 26, 1994
Sold by
Hunter Andrea L
Bought by
Warlick E Kenneth Mia S
Home Financials for this Owner
Home Financials are based on the most recent Mortgage that was taken out on this home.
Original Mortgage
$106,650
Interest Rate
8.37%
Create a Home Valuation Report for This Property
The Home Valuation Report is an in-depth analysis detailing your home's value as well as a comparison with similar homes in the area
Home Values in the Area
Average Home Value in this Area
Purchase History
| Date | Buyer | Sale Price | Title Company |
|---|---|---|---|
| Bond Robin L Tr | -- | -- | |
| Bond Robin | -- | -- | |
| Bond Robert | $200,000 | -- | |
| Warlick E Kenneth Mia S | $118,500 | -- |
Source: Public Records
Mortgage History
| Date | Status | Borrower | Loan Amount |
|---|---|---|---|
| Previous Owner | Bond Robert | $196,910 | |
| Previous Owner | Warlick E Kenneth Mia S | $106,650 |
Source: Public Records
Tax History Compared to Growth
Tax History
| Year | Tax Paid | Tax Assessment Tax Assessment Total Assessment is a certain percentage of the fair market value that is determined by local assessors to be the total taxable value of land and additions on the property. | Land | Improvement |
|---|---|---|---|---|
| 2025 | $522 | $140,080 | $37,400 | $102,680 |
| 2023 | $522 | $160,200 | $49,520 | $110,680 |
| 2022 | $2,155 | $145,440 | $41,880 | $103,560 |
| 2021 | $2,548 | $114,920 | $25,960 | $88,960 |
| 2020 | $2,586 | $111,360 | $39,320 | $72,040 |
| 2019 | $419 | $109,360 | $38,600 | $70,760 |
| 2018 | $2,541 | $106,840 | $37,720 | $69,120 |
| 2017 | $1,982 | $79,880 | $24,400 | $55,480 |
| 2016 | $1,981 | $79,880 | $24,400 | $55,480 |
| 2015 | $2,424 | $79,880 | $24,400 | $55,480 |
| 2014 | $1,483 | $61,120 | $18,680 | $42,440 |
Source: Public Records
Map
Nearby Homes
- 400 Longleaf Dr
- 360 Longleaf Dr Unit 1
- 680 Huntwick Place
- 670 Huntwick Place
- 9625 Pine Thicket Way
- 425 Longleaf Dr
- 9600 Loblolly Ln
- 660 Huntwick Place
- 4660 Loblolly Ln
- 9630 Pine Thicket Way
- 675 Huntwick Place
- 9635 Pine Thicket Way
- 9605 Loblolly Ln Unit 1
- 9640 Loblolly Ln Unit 1
- 440 Longleaf Dr
- 9615 Loblolly Ln
- 665 Huntwick Place
- 655 Huntwick Place
- 9645 Pine Thicket Way
- 9640 Pine Thicket Way