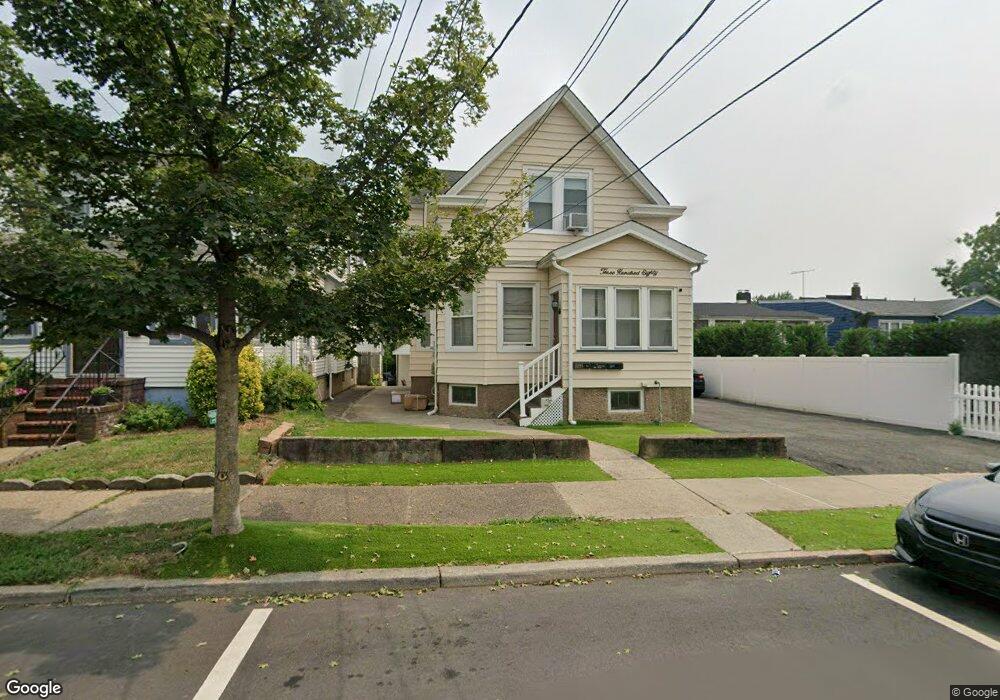
380 N 11th St Unit 2 Prospect Park, NJ 07508
Estimated Value: $619,321 - $691,000
2
Beds
1
Bath
1,773
Sq Ft
$369/Sq Ft
Est. Value
About This Home
This home is located at 380 N 11th St Unit 2, Prospect Park, NJ 07508 and is currently estimated at $654,080, approximately $368 per square foot. 380 N 11th St Unit 2 is a home located in Passaic County with nearby schools including Number 1, Prospect Park Elementary School, Manchester Reg High School, and Al-Hikmah Elementary School.
Ownership History
Date
Name
Owned For
Owner Type
Purchase Details
Closed on
Sep 2, 2021
Sold by
Jerry Etienne
Bought by
Etienne Jerry and Akyirem Kwabena
Current Estimated Value
Purchase Details
Closed on
Feb 23, 2021
Sold by
Zaku Astrit and Zaku Artime
Bought by
Etienne Jerry
Home Financials for this Owner
Home Financials are based on the most recent Mortgage that was taken out on this home.
Original Mortgage
$430,148
Interest Rate
3%
Mortgage Type
FHA
Purchase Details
Closed on
Feb 1, 2006
Sold by
Stambouly Joseph
Bought by
Zaku Astrit and Zaku Artime
Home Financials for this Owner
Home Financials are based on the most recent Mortgage that was taken out on this home.
Original Mortgage
$236,000
Interest Rate
6.17%
Mortgage Type
New Conventional
Create a Home Valuation Report for This Property
The Home Valuation Report is an in-depth analysis detailing your home's value as well as a comparison with similar homes in the area
Home Values in the Area
Average Home Value in this Area
Purchase History
| Date | Buyer | Sale Price | Title Company |
|---|---|---|---|
| Etienne Jerry | -- | Fidelity National Title | |
| Etienne Jerry | -- | Fidelity National Title | |
| Etienne Jerry | $445,000 | Foundation Title Llc | |
| Etienne Jerry | $445,000 | Fidelity National Title | |
| Zaku Astrit | $295,000 | -- |
Source: Public Records
Mortgage History
| Date | Status | Borrower | Loan Amount |
|---|---|---|---|
| Previous Owner | Etienne Jerry | $430,148 | |
| Previous Owner | Zaku Astrit | $236,000 |
Source: Public Records
Tax History Compared to Growth
Tax History
| Year | Tax Paid | Tax Assessment Tax Assessment Total Assessment is a certain percentage of the fair market value that is determined by local assessors to be the total taxable value of land and additions on the property. | Land | Improvement |
|---|---|---|---|---|
| 2025 | $13,658 | $229,500 | $65,300 | $164,200 |
| 2024 | $12,673 | $229,500 | $65,300 | $164,200 |
| 2022 | $11,543 | $211,300 | $65,300 | $146,000 |
| 2021 | $11,412 | $211,300 | $65,300 | $146,000 |
| 2020 | $11,051 | $211,300 | $65,300 | $146,000 |
| 2019 | $10,937 | $211,300 | $65,300 | $146,000 |
| 2018 | $10,829 | $211,300 | $65,300 | $146,000 |
| 2017 | $10,677 | $211,300 | $65,300 | $146,000 |
| 2016 | $10,622 | $213,000 | $65,300 | $147,700 |
| 2015 | $10,045 | $213,000 | $65,300 | $147,700 |
| 2014 | $8,477 | $128,400 | $50,000 | $78,400 |
Source: Public Records
Map
Nearby Homes
- 380 N 11th St
- 384 N 11th St
- 378 N 11th St
- 388 N 11th St
- 377 N 10th St
- 372 N 11th St
- 383 N 10th St
- 371 N 10th St
- 369 N 10th St
- 53 Struyk Ave
- 57 Struyk Ave
- 57 Struyk Ave Unit 2
- 57 Struyk Ave Unit 1
- 368 N 11th St Unit 1
- 368 N 11th St
- 377 N 11th St
- 381 N 11th St
- 381 N 11th St Unit 2
- 387-389 N 11th St
- 375 N 11th St