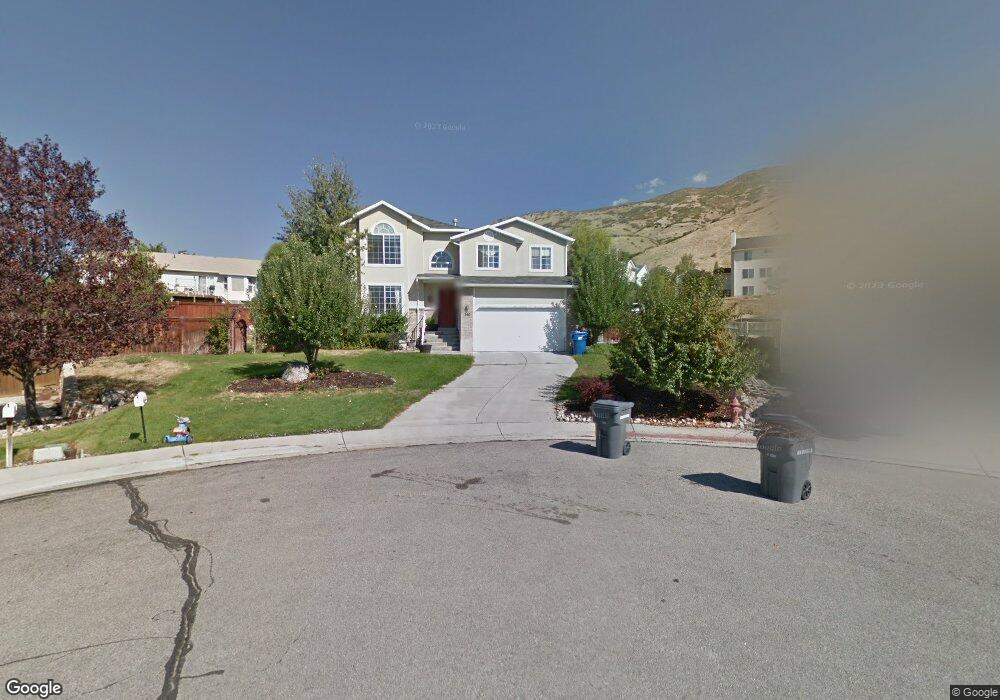
380 N 930 E Lindon, UT 84042
Estimated Value: $657,516 - $835,000
4
Beds
2
Baths
2,830
Sq Ft
$250/Sq Ft
Est. Value
About This Home
This home is located at 380 N 930 E, Lindon, UT 84042 and is currently estimated at $708,379, approximately $250 per square foot. 380 N 930 E is a home located in Utah County with nearby schools including Rocky Mountain Elementary, Oak Canyon Junior High School, and Pleasant Grove High School.
Ownership History
Date
Name
Owned For
Owner Type
Purchase Details
Closed on
Aug 30, 2005
Sold by
Lee J Franklin
Bought by
Andersen Koby and Andersen Alicia
Current Estimated Value
Home Financials for this Owner
Home Financials are based on the most recent Mortgage that was taken out on this home.
Original Mortgage
$186,400
Outstanding Balance
$98,216
Interest Rate
5.61%
Mortgage Type
Fannie Mae Freddie Mac
Estimated Equity
$610,163
Purchase Details
Closed on
Oct 18, 1999
Sold by
Ruchika Khandelwal Jhalani Family Protec and Jhalani Ruchika Khandelwal
Bought by
Lee J Franklin
Home Financials for this Owner
Home Financials are based on the most recent Mortgage that was taken out on this home.
Original Mortgage
$161,900
Interest Rate
7.82%
Purchase Details
Closed on
Dec 17, 1996
Sold by
Jhalani Sudhir and Jhalani Ruchika
Bought by
Sudhir Jhalani Family Protection Trust
Create a Home Valuation Report for This Property
The Home Valuation Report is an in-depth analysis detailing your home's value as well as a comparison with similar homes in the area
Home Values in the Area
Average Home Value in this Area
Purchase History
| Date | Buyer | Sale Price | Title Company |
|---|---|---|---|
| Andersen Koby | -- | Bartlett Title Insurance Ag | |
| Lee J Franklin | -- | Empire Land Title Company | |
| Sudhir Jhalani Family Protection Trust | -- | -- | |
| Ruchika Khandelwal Jhalani Family Protec | -- | -- |
Source: Public Records
Mortgage History
| Date | Status | Borrower | Loan Amount |
|---|---|---|---|
| Open | Andersen Koby | $186,400 | |
| Closed | Andersen Koby | $34,950 | |
| Previous Owner | Lee J Franklin | $161,900 |
Source: Public Records
Tax History Compared to Growth
Tax History
| Year | Tax Paid | Tax Assessment Tax Assessment Total Assessment is a certain percentage of the fair market value that is determined by local assessors to be the total taxable value of land and additions on the property. | Land | Improvement |
|---|---|---|---|---|
| 2025 | $2,225 | $308,550 | $224,600 | $336,400 |
| 2024 | $2,225 | $274,340 | $0 | $0 |
| 2023 | $2,086 | $276,155 | $0 | $0 |
| 2022 | $2,446 | $312,895 | $0 | $0 |
| 2021 | $2,202 | $424,700 | $152,000 | $272,700 |
| 2020 | $2,046 | $388,400 | $138,200 | $250,200 |
| 2019 | $1,796 | $355,800 | $138,200 | $217,600 |
| 2018 | $1,905 | $355,800 | $138,200 | $217,600 |
| 2017 | $1,843 | $184,525 | $0 | $0 |
| 2016 | $1,823 | $168,850 | $0 | $0 |
| 2015 | $1,725 | $151,030 | $0 | $0 |
| 2014 | $1,551 | $134,530 | $0 | $0 |
Source: Public Records
Map
Nearby Homes