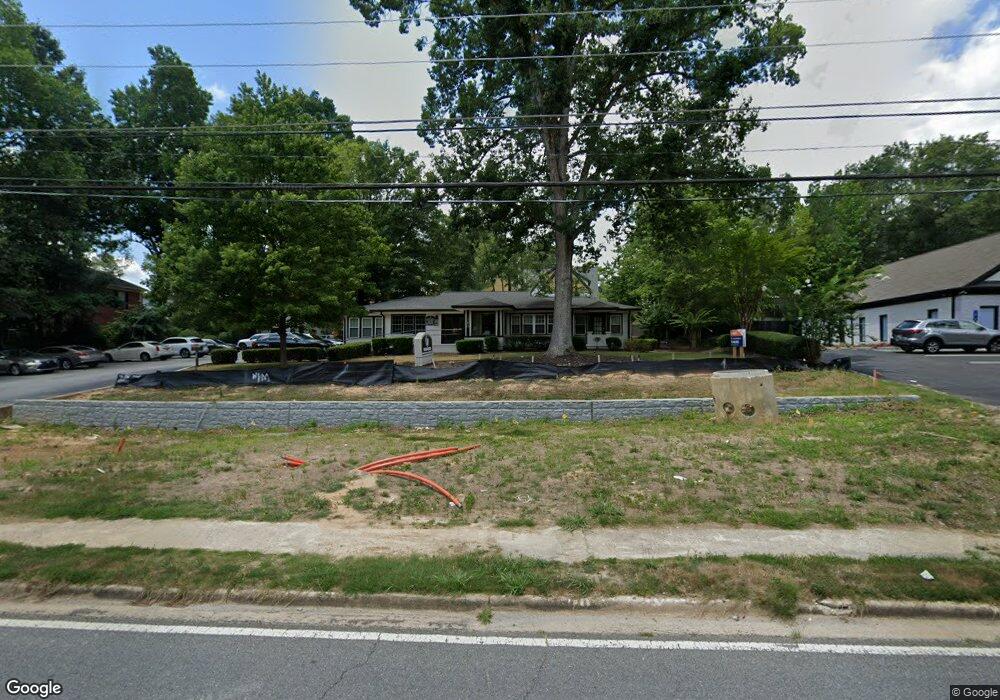
380 N Main St Alpharetta, GA 30009
Estimated Value: $1,349,000 - $1,694,059
3
Beds
1
Bath
4,309
Sq Ft
$364/Sq Ft
Est. Value
About This Home
This home is located at 380 N Main St, Alpharetta, GA 30009 and is currently estimated at $1,570,020, approximately $364 per square foot. 380 N Main St is a home located in Fulton County with nearby schools including Alpharetta Elementary School, Hopewell Middle School, and Cambridge High School.
Ownership History
Date
Name
Owned For
Owner Type
Purchase Details
Closed on
Aug 28, 2024
Sold by
3Mj Llc
Bought by
3Pg Real Estate Holdings Llc
Current Estimated Value
Purchase Details
Closed on
Nov 9, 2022
Sold by
380 Holdings Llc
Bought by
3Mj Llc
Home Financials for this Owner
Home Financials are based on the most recent Mortgage that was taken out on this home.
Original Mortgage
$1,450,000
Interest Rate
7.08%
Mortgage Type
New Conventional
Purchase Details
Closed on
Aug 25, 2015
Sold by
Cobalt 4 Grp Llc
Bought by
380 Holdings Llc
Home Financials for this Owner
Home Financials are based on the most recent Mortgage that was taken out on this home.
Original Mortgage
$400,000
Interest Rate
4.02%
Mortgage Type
Commercial
Purchase Details
Closed on
Sep 16, 2004
Sold by
Mackenzie Rodney
Bought by
Cobalt 4 Group Llc
Home Financials for this Owner
Home Financials are based on the most recent Mortgage that was taken out on this home.
Original Mortgage
$430,929
Interest Rate
5.73%
Purchase Details
Closed on
Aug 29, 2002
Sold by
Brown Mary C M
Bought by
Mackenzie Rodney
Home Financials for this Owner
Home Financials are based on the most recent Mortgage that was taken out on this home.
Original Mortgage
$237,915
Interest Rate
5.98%
Create a Home Valuation Report for This Property
The Home Valuation Report is an in-depth analysis detailing your home's value as well as a comparison with similar homes in the area
Home Values in the Area
Average Home Value in this Area
Purchase History
| Date | Buyer | Sale Price | Title Company |
|---|---|---|---|
| 3Pg Real Estate Holdings Llc | $1,665,000 | -- | |
| 3Pg Real Estate Holdings Llc | -- | -- | |
| 3Mj Llc | $1,250,000 | -- | |
| 380 Holdings Llc | $650,000 | -- | |
| Cobalt 4 Group Llc | -- | -- | |
| Mackenzie Rodney | $279,900 | -- |
Source: Public Records
Mortgage History
| Date | Status | Borrower | Loan Amount |
|---|---|---|---|
| Previous Owner | 3Mj Llc | $1,450,000 | |
| Previous Owner | 380 Holdings Llc | $400,000 | |
| Previous Owner | Cobalt 4 Group Llc | $430,929 | |
| Previous Owner | Mackenzie Rodney | $237,915 |
Source: Public Records
Tax History Compared to Growth
Tax History
| Year | Tax Paid | Tax Assessment Tax Assessment Total Assessment is a certain percentage of the fair market value that is determined by local assessors to be the total taxable value of land and additions on the property. | Land | Improvement |
|---|---|---|---|---|
| 2025 | $2,365 | $411,240 | $339,120 | $72,120 |
| 2023 | $13,984 | $495,440 | $339,120 | $156,320 |
| 2022 | $7,380 | $280,520 | $125,560 | $154,960 |
| 2021 | $9,224 | $280,520 | $125,560 | $154,960 |
| 2020 | $9,054 | $269,920 | $125,560 | $144,360 |
| 2019 | $1,554 | $270,280 | $125,560 | $144,720 |
| 2018 | $7,846 | $277,960 | $129,680 | $148,280 |
| 2017 | $7,586 | $260,000 | $142,960 | $117,040 |
| 2016 | $7,588 | $260,000 | $142,960 | $117,040 |
| 2015 | $8,267 | $235,840 | $129,680 | $106,160 |
| 2014 | $7,229 | $235,840 | $129,680 | $106,160 |
Source: Public Records
Map
Nearby Homes
- 150 Shady Grove Ln
- 264 N Main St
- 254 N Main St
- 193 Jere Dr
- 2632 Vintage Dr Unit 9
- 326 Andover Dr
- 2644 Vintage Dr
- 410 Anglin Walk
- 1045 Winthrope Chase Dr
- 141 North Trace
- 5610 Surrey Ct
- 265 Mayfield Rd
- 320 Shady Grove Ln
- 171 Upshaw Dr
- 250 Mayfield Rd
- 181 Brooke Dr
- 295 Pebble Trail
- 260 Mayfield Rd
- 136 Canton St
- 1085 Pine Grove Dr
- 366 N Main St Unit 200
- 381a Canton St
- 371 Canton St Unit B
- 371 Canton St
- 393 Canton St
- 400 N Main St
- 361 Canton St
- 401 Canton St
- 410 N Main St
- 351 Canton St
- 100 Pebble Trail
- 105 Shady Grove Ln
- 1890 N Creek Cir
- 418 N Main St
- 1880 N Creek Cir Unit 3
- 339 Canton St
- 1105 Winthrope Park Dr
- 1900 N Creek Cir
- 333 N Main St