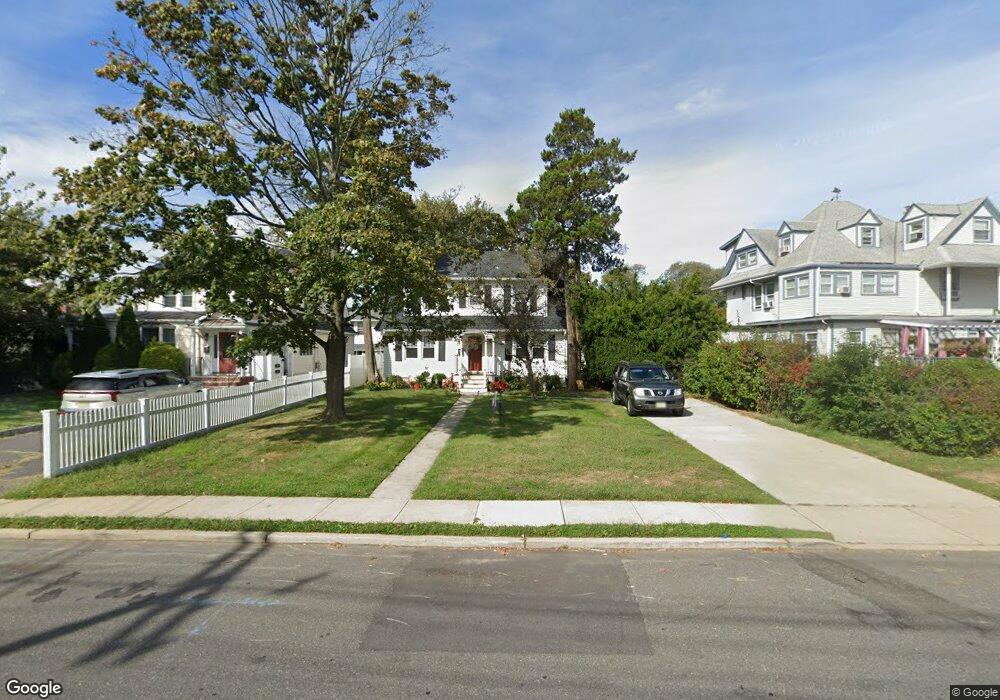
380 Sairs Ave Long Branch, NJ 07740
Estimated Value: $756,000 - $792,000
3
Beds
2
Baths
1,596
Sq Ft
$484/Sq Ft
Est. Value
About This Home
This home is located at 380 Sairs Ave, Long Branch, NJ 07740 and is currently estimated at $772,551, approximately $484 per square foot. 380 Sairs Ave is a home located in Monmouth County with nearby schools including Long Branch High School, Holy Trinity School, and Bet Yaakov of the Jersey Shore.
Ownership History
Date
Name
Owned For
Owner Type
Purchase Details
Closed on
Jun 7, 2019
Sold by
Seaglass Investments Llc
Bought by
Olson Logan
Current Estimated Value
Home Financials for this Owner
Home Financials are based on the most recent Mortgage that was taken out on this home.
Original Mortgage
$129,000
Interest Rate
4%
Mortgage Type
Commercial
Purchase Details
Closed on
Apr 29, 2019
Sold by
Sagan Andrew
Bought by
Seaglass Investments Llc
Home Financials for this Owner
Home Financials are based on the most recent Mortgage that was taken out on this home.
Original Mortgage
$129,000
Interest Rate
4%
Mortgage Type
Commercial
Purchase Details
Closed on
Mar 11, 2013
Sold by
Sagan Andrew
Bought by
Sagan Andrew
Create a Home Valuation Report for This Property
The Home Valuation Report is an in-depth analysis detailing your home's value as well as a comparison with similar homes in the area
Home Values in the Area
Average Home Value in this Area
Purchase History
| Date | Buyer | Sale Price | Title Company |
|---|---|---|---|
| Olson Logan | $120,000 | Westcor Land Title Ins Co | |
| Seaglass Investments Llc | $120,000 | Trident Abstract Ttl Agcy Ll | |
| Sagan Andrew | -- | Attorney |
Source: Public Records
Mortgage History
| Date | Status | Borrower | Loan Amount |
|---|---|---|---|
| Closed | Seaglass Investments Llc | $129,000 |
Source: Public Records
Tax History Compared to Growth
Tax History
| Year | Tax Paid | Tax Assessment Tax Assessment Total Assessment is a certain percentage of the fair market value that is determined by local assessors to be the total taxable value of land and additions on the property. | Land | Improvement |
|---|---|---|---|---|
| 2025 | $9,609 | $660,400 | $424,200 | $236,200 |
| 2024 | $8,385 | $625,200 | $399,200 | $226,000 |
| 2023 | $8,385 | $539,900 | $324,200 | $215,700 |
| 2022 | $7,464 | $457,300 | $267,300 | $190,000 |
| 2021 | $7,464 | $373,000 | $195,300 | $177,700 |
| 2020 | $7,378 | $353,000 | $176,300 | $176,700 |
| 2019 | $7,246 | $344,700 | $176,300 | $168,400 |
| 2018 | $7,243 | $342,600 | $180,300 | $162,300 |
| 2017 | $6,832 | $331,500 | $172,300 | $159,200 |
| 2016 | $6,718 | $332,400 | $177,300 | $155,100 |
| 2015 | $4,828 | $216,800 | $87,500 | $129,300 |
| 2014 | $4,767 | $225,600 | $110,900 | $114,700 |
Source: Public Records
Map
Nearby Homes
- 12 Coral Place
- 464 2nd Ave
- 119 Avery Ave Unit H21
- 17 Tower Rd Unit D2
- 14 Tower Rd
- 12 Seashore Dr
- 14 Seashore Dr
- 8 Seashore Dr
- 11 Seashore Dr
- 215 Cleveland Ave
- 377 Westwood Ave
- 303 Westwood Ave
- 23 Woolley Ave
- 392 Ocean Ave Unit 1302
- 392 Ocean Ave Unit 1608
- 392 Ocean Ave Unit 1203
- 392 Ocean Ave Unit 1412
- 392 Ocean Ave Unit 1502
- 392 Ocean Ave Unit 1505
- 392 Ocean Ave Unit 1705