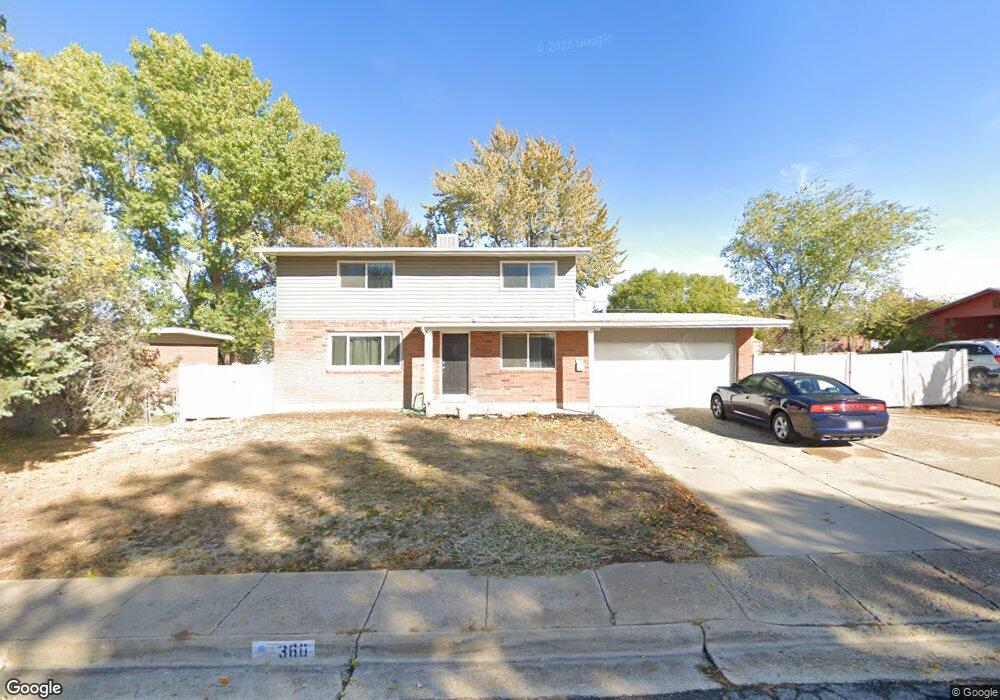
380 W 825 N Clearfield, UT 84015
Estimated Value: $420,000 - $515,000
5
Beds
2
Baths
2,061
Sq Ft
$221/Sq Ft
Est. Value
About This Home
This home is located at 380 W 825 N, Clearfield, UT 84015 and is currently estimated at $454,910, approximately $220 per square foot. 380 W 825 N is a home located in Davis County with nearby schools including Doxey Elementary School, Sunset Junior High School, and Northridge High School.
Ownership History
Date
Name
Owned For
Owner Type
Purchase Details
Closed on
Jul 29, 2024
Sold by
Cooper Mark and Cooper Courtney
Bought by
Cooper Mark and Cooper Courtney
Current Estimated Value
Home Financials for this Owner
Home Financials are based on the most recent Mortgage that was taken out on this home.
Original Mortgage
$391,500
Outstanding Balance
$372,291
Interest Rate
6.17%
Mortgage Type
Balloon
Estimated Equity
$82,619
Purchase Details
Closed on
Jul 27, 2016
Sold by
Christensen Keith and Christensen Victoria
Bought by
Christensen Family Prop Llc
Purchase Details
Closed on
Oct 8, 2014
Sold by
Kirkham Jim and Kirkham Joan G
Bought by
Federal National Mortgage Association
Purchase Details
Closed on
Mar 12, 1998
Sold by
Cree Gregory M and Cree Debra L
Bought by
Kirkham Jim and Joan Kirkham G
Home Financials for this Owner
Home Financials are based on the most recent Mortgage that was taken out on this home.
Original Mortgage
$104,025
Interest Rate
7%
Create a Home Valuation Report for This Property
The Home Valuation Report is an in-depth analysis detailing your home's value as well as a comparison with similar homes in the area
Home Values in the Area
Average Home Value in this Area
Purchase History
| Date | Buyer | Sale Price | Title Company |
|---|---|---|---|
| Cooper Mark | -- | Northern Title Company | |
| Cooper Mark | -- | Old Republic Title | |
| Christensen Family Prop Llc | -- | Backman Title | |
| Christensen Keith | -- | Backman Title | |
| Federal National Mortgage Association | $122,000 | Etitle Insurance Age | |
| Kirkham Jim | -- | Mountain View Title & Escrow |
Source: Public Records
Mortgage History
| Date | Status | Borrower | Loan Amount |
|---|---|---|---|
| Open | Cooper Mark | $391,500 | |
| Previous Owner | Kirkham Jim | $104,025 |
Source: Public Records
Tax History
| Year | Tax Paid | Tax Assessment Tax Assessment Total Assessment is a certain percentage of the fair market value that is determined by local assessors to be the total taxable value of land and additions on the property. | Land | Improvement |
|---|---|---|---|---|
| 2025 | $2,496 | $227,700 | $74,433 | $153,267 |
| 2024 | $2,104 | $191,949 | $71,144 | $120,805 |
| 2023 | $1,966 | $179,850 | $62,501 | $117,348 |
| 2022 | $2,089 | $342,000 | $118,146 | $223,854 |
| 2021 | $1,795 | $254,000 | $70,041 | $183,959 |
| 2020 | $1,574 | $219,000 | $59,102 | $159,898 |
| 2019 | $1,492 | $213,000 | $75,027 | $137,973 |
| 2018 | $1,346 | $188,000 | $59,958 | $128,042 |
| 2016 | $1,085 | $77,880 | $28,351 | $49,529 |
| 2015 | $1,115 | $75,845 | $28,351 | $47,494 |
| 2014 | $1,074 | $74,683 | $28,539 | $46,144 |
| 2013 | -- | $70,643 | $23,265 | $47,378 |
Source: Public Records
Map
Nearby Homes
Your Personal Tour Guide
Ask me questions while you tour the home.