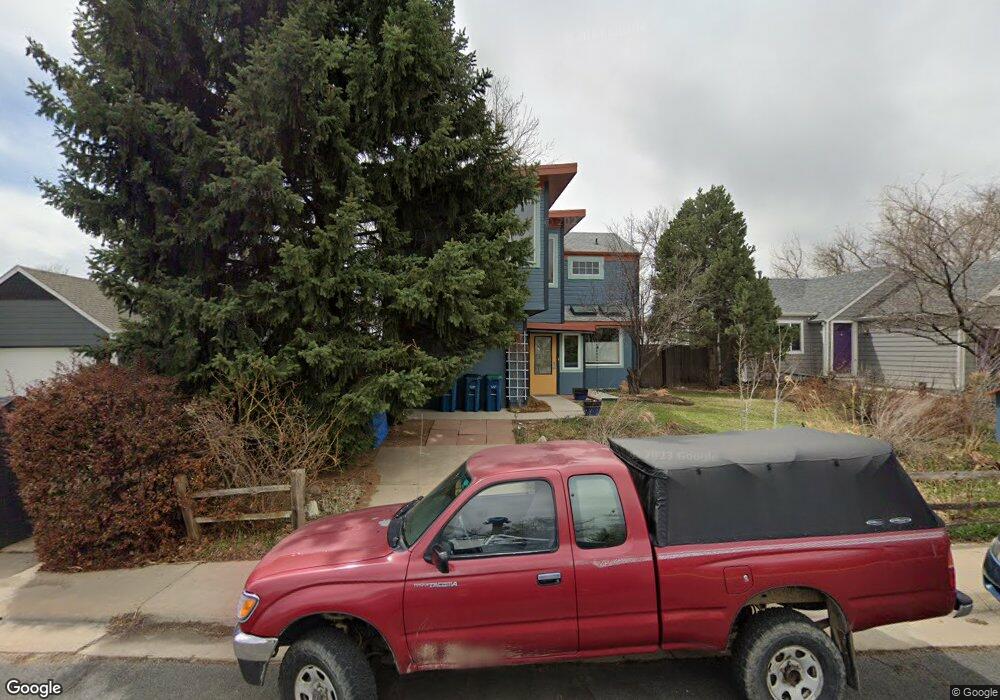
380 W Sycamore Ln Louisville, CO 80027
Estimated Value: $762,751 - $837,000
3
Beds
2
Baths
1,310
Sq Ft
$615/Sq Ft
Est. Value
About This Home
This home is located at 380 W Sycamore Ln, Louisville, CO 80027 and is currently estimated at $806,188, approximately $615 per square foot. 380 W Sycamore Ln is a home located in Boulder County with nearby schools including Louisville Elementary School, Louisville Middle School, and Monarch High School.
Ownership History
Date
Name
Owned For
Owner Type
Purchase Details
Closed on
May 25, 2007
Sold by
Bieck Nathan L
Bought by
Kemperman Suzanne and Fox John Randall
Current Estimated Value
Home Financials for this Owner
Home Financials are based on the most recent Mortgage that was taken out on this home.
Original Mortgage
$218,400
Outstanding Balance
$132,773
Interest Rate
6.16%
Mortgage Type
Purchase Money Mortgage
Estimated Equity
$673,415
Purchase Details
Closed on
Jul 24, 2003
Sold by
Aschoff Andrea M
Bought by
Bieck Nathan L
Home Financials for this Owner
Home Financials are based on the most recent Mortgage that was taken out on this home.
Original Mortgage
$244,660
Interest Rate
5.19%
Mortgage Type
FHA
Purchase Details
Closed on
Oct 4, 1989
Bought by
Suzanne Kemperman and Fox John Randall
Purchase Details
Closed on
Oct 7, 1983
Bought by
Suzanne Kemperman and Fox John Randall
Purchase Details
Closed on
Aug 24, 1982
Bought by
Suzanne Kemperman and Fox John Randall
Create a Home Valuation Report for This Property
The Home Valuation Report is an in-depth analysis detailing your home's value as well as a comparison with similar homes in the area
Home Values in the Area
Average Home Value in this Area
Purchase History
| Date | Buyer | Sale Price | Title Company |
|---|---|---|---|
| Kemperman Suzanne | $273,000 | Guardian Title Agency Llc | |
| Bieck Nathan L | $248,500 | Guardian Title Agency Llc | |
| Suzanne Kemperman | $72,000 | -- | |
| Suzanne Kemperman | $76,400 | -- | |
| Suzanne Kemperman | $475,000 | -- |
Source: Public Records
Mortgage History
| Date | Status | Borrower | Loan Amount |
|---|---|---|---|
| Open | Kemperman Suzanne | $218,400 | |
| Previous Owner | Bieck Nathan L | $244,660 |
Source: Public Records
Tax History Compared to Growth
Tax History
| Year | Tax Paid | Tax Assessment Tax Assessment Total Assessment is a certain percentage of the fair market value that is determined by local assessors to be the total taxable value of land and additions on the property. | Land | Improvement |
|---|---|---|---|---|
| 2025 | $4,007 | $52,469 | $22,313 | $30,156 |
| 2024 | $4,007 | $52,469 | $22,313 | $30,156 |
| 2023 | $3,939 | $51,282 | $24,180 | $30,787 |
| 2022 | $3,137 | $39,552 | $18,306 | $21,246 |
| 2021 | $3,305 | $42,836 | $19,827 | $23,009 |
| 2020 | $2,883 | $37,953 | $16,660 | $21,293 |
| 2019 | $2,842 | $37,953 | $16,660 | $21,293 |
| 2018 | $3,111 | $34,826 | $8,352 | $26,474 |
| 2017 | $3,049 | $38,503 | $9,234 | $29,269 |
| 2016 | $2,175 | $24,724 | $12,338 | $12,386 |
| 2015 | $2,062 | $21,898 | $11,781 | $10,117 |
| 2014 | $1,832 | $21,429 | $11,781 | $9,648 |
Source: Public Records
Map
Nearby Homes
- 291 W Sycamore Ln
- 513 Adams Ave
- 426 W Spruce Ln
- 408 Fillmore Ct
- 474 W Spruce St
- 159 S Polk Ave
- 310 W Spruce St
- 494 Owl Dr Unit 4
- 701 Garfield Ave
- 641 W Dahlia St
- 1025 Sagebrush Way
- 118 S Tanager Ct
- 501 Lois Dr
- 503 Lois Dr
- 298 S Hoover Ave
- 516 Grant Ave
- 593 Wildrose Way
- 203 Springs Dr
- 111 Barbara St
- 724 Johnson St
- 392 W Sycamore Ln
- 376 W Sycamore Ln
- 398 W Sycamore Ln
- 402 W Sycamore Ct
- 346 W Sycamore Ln
- 381 W Sycamore Ln
- 375 W Sycamore Ln
- 353 W Sycamore Ln
- 418 W Sycamore Ct
- 339 W Sycamore Ln
- 322 W Sycamore Ln
- 409 W Sycamore Ct
- 327 W Sycamore Ln
- 424 W Sycamore Ct
- 415 W Sycamore Ct
- 310 W Sycamore Ln
- 305 W Sycamore Ln
- 440 W Sycamore Ct
- 421 W Sycamore Ct
- 294 W Sycamore Ln