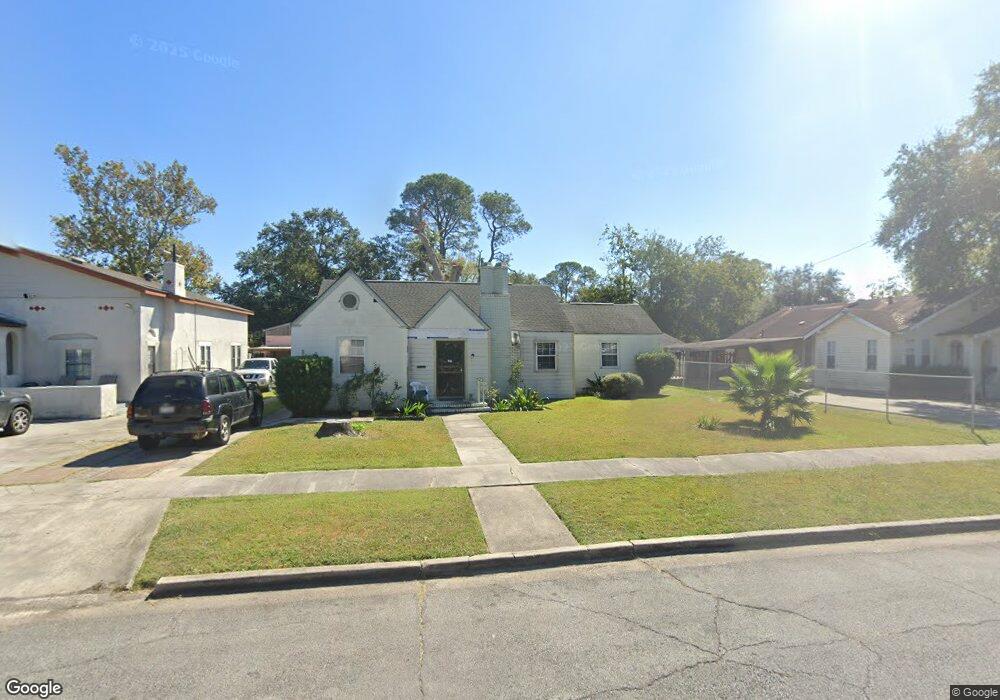
3800 4th St Port Arthur, TX 77642
Estimated Value: $83,000 - $131,000
--
Bed
--
Bath
1,553
Sq Ft
$68/Sq Ft
Est. Value
About This Home
This home is located at 3800 4th St, Port Arthur, TX 77642 and is currently estimated at $105,690, approximately $68 per square foot. 3800 4th St is a home located in Jefferson County with nearby schools including Lakeview Elementary School, Jefferson Middle School, and Memorial High School.
Ownership History
Date
Name
Owned For
Owner Type
Purchase Details
Closed on
Aug 20, 2009
Sold by
Zayler Stephen J
Bought by
Joubert Effrey
Current Estimated Value
Purchase Details
Closed on
Feb 2, 2007
Sold by
Nybor Investments
Bought by
Joubert Effrey
Purchase Details
Closed on
Dec 27, 2005
Sold by
Leyendecker Barry
Bought by
Nybor Investments
Purchase Details
Closed on
Jul 30, 2004
Sold by
Leyendecker Barry
Bought by
Nybor Investments and Roberts Robyn
Purchase Details
Closed on
Mar 19, 2004
Sold by
Federal National Mortgage Association
Bought by
Leyendecker Barry W
Purchase Details
Closed on
Dec 2, 2003
Sold by
Jackson Evelyn Nevay
Bought by
Fannie Mae and Federal National Mortgage Association
Create a Home Valuation Report for This Property
The Home Valuation Report is an in-depth analysis detailing your home's value as well as a comparison with similar homes in the area
Home Values in the Area
Average Home Value in this Area
Purchase History
| Date | Buyer | Sale Price | Title Company |
|---|---|---|---|
| Joubert Effrey | $7,555 | None Available | |
| Joubert Effrey | $25,000 | None Available | |
| Nybor Investments | $12,000 | -- | |
| Nybor Investments | $12,000 | -- | |
| Leyendecker Barry W | -- | -- | |
| Fannie Mae | $11,053 | -- |
Source: Public Records
Mortgage History
| Date | Status | Borrower | Loan Amount |
|---|---|---|---|
| Closed | Nybor Investments | $0 |
Source: Public Records
Tax History Compared to Growth
Tax History
| Year | Tax Paid | Tax Assessment Tax Assessment Total Assessment is a certain percentage of the fair market value that is determined by local assessors to be the total taxable value of land and additions on the property. | Land | Improvement |
|---|---|---|---|---|
| 2025 | $44 | $54,296 | -- | -- |
| 2024 | $44 | $49,360 | -- | -- |
| 2023 | $44 | $44,873 | $0 | $0 |
| 2022 | $1,296 | $40,794 | $0 | $0 |
| 2021 | $1,229 | $95,633 | $4,365 | $91,268 |
| 2020 | $16 | $33,714 | $4,365 | $29,349 |
| 2019 | $1,003 | $31,470 | $4,370 | $27,100 |
| 2018 | $1 | $31,470 | $4,370 | $27,100 |
| 2017 | $1 | $31,470 | $4,370 | $27,100 |
| 2016 | $922 | $31,470 | $4,370 | $27,100 |
| 2015 | $30 | $31,470 | $4,370 | $27,100 |
| 2014 | $30 | $35,980 | $4,370 | $31,610 |
Source: Public Records
Map
Nearby Homes