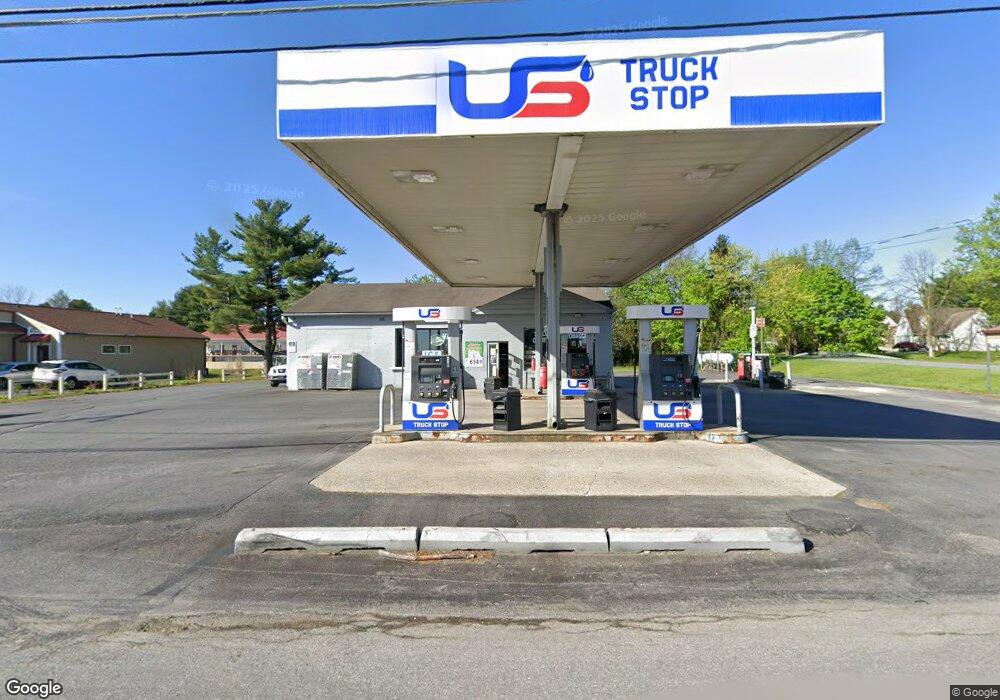
3800 Horseshoe Pike Honey Brook, PA 19344
Estimated Value: $895,229
--
Bed
--
Bath
1,296
Sq Ft
$691/Sq Ft
Est. Value
About This Home
This home is located at 3800 Horseshoe Pike, Honey Brook, PA 19344 and is currently estimated at $895,229, approximately $690 per square foot. 3800 Horseshoe Pike is a home located in Chester County with nearby schools including Honey Brook Elementary Center, Twin Valley Middle School, and Twin Valley High School.
Ownership History
Date
Name
Owned For
Owner Type
Purchase Details
Closed on
Oct 5, 2017
Sold by
Horseshoe Petroleum Llc
Bought by
G R Realty Lp
Current Estimated Value
Home Financials for this Owner
Home Financials are based on the most recent Mortgage that was taken out on this home.
Original Mortgage
$154,141
Outstanding Balance
$128,613
Interest Rate
3.78%
Mortgage Type
New Conventional
Estimated Equity
$766,616
Purchase Details
Closed on
Nov 28, 2012
Sold by
3800 Horseshore Pike Llc
Bought by
Horseshoe Petroleum Llc
Home Financials for this Owner
Home Financials are based on the most recent Mortgage that was taken out on this home.
Original Mortgage
$365,000
Interest Rate
3.38%
Mortgage Type
Commercial
Purchase Details
Closed on
Dec 8, 2006
Sold by
Byler Management Co Llc
Bought by
3800 Horseshoe Pike Llc
Purchase Details
Closed on
Jul 29, 1999
Sold by
Abe Oil Company
Bought by
Byler Management Co Llc
Create a Home Valuation Report for This Property
The Home Valuation Report is an in-depth analysis detailing your home's value as well as a comparison with similar homes in the area
Home Values in the Area
Average Home Value in this Area
Purchase History
| Date | Buyer | Sale Price | Title Company |
|---|---|---|---|
| G R Realty Lp | -- | -- | |
| Horseshoe Petroleum Llc | $465,000 | None Available | |
| 3800 Horseshoe Pike Llc | $225,000 | None Available | |
| Byler Management Co Llc | $173,790 | -- |
Source: Public Records
Mortgage History
| Date | Status | Borrower | Loan Amount |
|---|---|---|---|
| Open | G R Realty Lp | $154,141 | |
| Previous Owner | Horseshoe Petroleum Llc | $365,000 |
Source: Public Records
Tax History Compared to Growth
Tax History
| Year | Tax Paid | Tax Assessment Tax Assessment Total Assessment is a certain percentage of the fair market value that is determined by local assessors to be the total taxable value of land and additions on the property. | Land | Improvement |
|---|---|---|---|---|
| 2025 | $4,245 | $110,560 | $42,810 | $67,750 |
| 2024 | $4,245 | $110,560 | $42,810 | $67,750 |
| 2023 | $4,148 | $110,560 | $42,810 | $67,750 |
| 2022 | $4,103 | $110,560 | $42,810 | $67,750 |
| 2021 | $3,983 | $110,560 | $42,810 | $67,750 |
| 2020 | $3,963 | $110,560 | $42,810 | $67,750 |
| 2019 | $3,845 | $110,560 | $42,810 | $67,750 |
| 2018 | $3,845 | $110,560 | $42,810 | $67,750 |
| 2017 | $3,754 | $110,560 | $42,810 | $67,750 |
| 2016 | $3,112 | $110,560 | $42,810 | $67,750 |
| 2015 | $3,112 | $110,560 | $42,810 | $67,750 |
| 2014 | $3,112 | $110,560 | $42,810 | $67,750 |
Source: Public Records
Map
Nearby Homes
- 35 Wagon Way
- 12 Vintage Ln
- 407 Cahill Cir Unit 4
- 159 Augusta Dr
- 70 Waynebrook Dr
- 50 Nevin Dr
- 0 Westbrook Dr
- 0 Westbrook Dr
- 0 Westbrook Dr
- 0 Westbrook Dr
- 650 Dampman Rd
- 230 Rock Rd
- 1 Tulip Dr
- 110 Hillbrook Dr
- 109 Brylin Dr
- 2200 Beaver Dam Rd
- 14 Blue Spruce Dr
- 113 Keystone Ct
- 24 Erica Cir
- 607 Buchland Rd
- 3816 Horseshoe Pike
- 3791 Horseshoe Pike Unit 10
- 3795 Horseshoe Pike Unit 20
- 3795 Horseshoe Pike Unit 10
- 3815 Horseshoe Pike
- 3797 Horseshoe Pike Unit 20
- 3797 Horseshoe Pike Unit 10
- 3797 Horseshoe Pike
- 90 Village Square
- 87 Roberts Ln
- 3836 Horseshoe Pike
- 3783 Horseshoe Pike
- 3821 White Horse Park
- 94 Village Square
- 88 Village Square
- 82 Roberts Ln
- 3835 Horseshoe Pike
- 95 Roberts Ln
- 104 Roberts Ln
- 3766 Horseshoe Pike