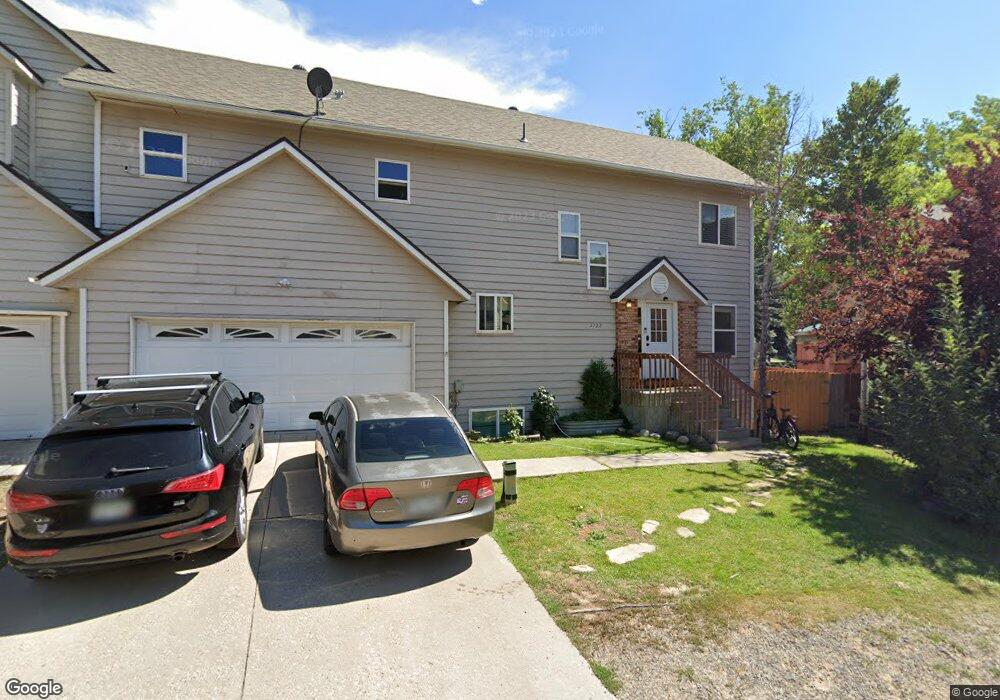
3800 Old Lodge Rd Unit 1D Glenwood Springs, CO 81601
Estimated Value: $516,000 - $543,177
2
Beds
2
Baths
1,116
Sq Ft
$474/Sq Ft
Est. Value
About This Home
This home is located at 3800 Old Lodge Rd Unit 1D, Glenwood Springs, CO 81601 and is currently estimated at $528,794, approximately $473 per square foot. 3800 Old Lodge Rd Unit 1D is a home located in Garfield County with nearby schools including St. Stephen Catholic School, Columbine Christian School, and Ambleside At Skylark.
Ownership History
Date
Name
Owned For
Owner Type
Purchase Details
Closed on
Mar 8, 2018
Sold by
Lowell Properties Limited
Bought by
Flohr Michael
Current Estimated Value
Home Financials for this Owner
Home Financials are based on the most recent Mortgage that was taken out on this home.
Original Mortgage
$225,000
Outstanding Balance
$191,745
Interest Rate
4.15%
Mortgage Type
New Conventional
Estimated Equity
$337,049
Purchase Details
Closed on
Apr 15, 2013
Sold by
Reynolds David
Bought by
Lowell Properties Limited
Purchase Details
Closed on
Mar 27, 2013
Sold by
Goodman Joshua S
Bought by
Reynolds David
Purchase Details
Closed on
Aug 24, 2005
Sold by
Henke Amber Lee
Bought by
Goodman Joshua S
Purchase Details
Closed on
Nov 25, 1998
Purchase Details
Closed on
Jun 12, 1997
Purchase Details
Closed on
Jun 11, 1987
Create a Home Valuation Report for This Property
The Home Valuation Report is an in-depth analysis detailing your home's value as well as a comparison with similar homes in the area
Home Values in the Area
Average Home Value in this Area
Purchase History
| Date | Buyer | Sale Price | Title Company |
|---|---|---|---|
| Flohr Michael | $250,000 | Title Co The Rockies | |
| Lowell Properties Limited | $140,000 | Land Title Guarantee Company | |
| Reynolds David | -- | None Available | |
| Goodman Joshua S | $210,000 | Land Title | |
| -- | $146,000 | -- | |
| -- | $125,000 | -- | |
| -- | $42,000 | -- |
Source: Public Records
Mortgage History
| Date | Status | Borrower | Loan Amount |
|---|---|---|---|
| Open | Flohr Michael | $225,000 |
Source: Public Records
Tax History Compared to Growth
Tax History
| Year | Tax Paid | Tax Assessment Tax Assessment Total Assessment is a certain percentage of the fair market value that is determined by local assessors to be the total taxable value of land and additions on the property. | Land | Improvement |
|---|---|---|---|---|
| 2024 | $1,868 | $25,100 | $0 | $25,100 |
| 2023 | $1,868 | $25,100 | $0 | $25,100 |
| 2022 | $1,526 | $19,210 | $0 | $19,210 |
| 2021 | $1,550 | $19,760 | $0 | $19,760 |
| 2020 | $1,407 | $18,990 | $0 | $18,990 |
| 2019 | $1,419 | $18,990 | $0 | $18,990 |
| 2018 | $1,342 | $18,160 | $0 | $18,160 |
| 2017 | $1,262 | $18,160 | $0 | $18,160 |
| 2016 | $1,039 | $14,760 | $0 | $14,760 |
| 2015 | $1,053 | $14,760 | $0 | $14,760 |
| 2014 | $763 | $11,200 | $0 | $11,200 |
Source: Public Records
Map
Nearby Homes
- 3800 Old Lodge Rd Unit A4
- 1122 Westlook Dr
- 1207 Mountain Dr
- 2711 2833 County Road 117
- 1069 Park Dr W
- 1563 Breen Alley
- 4242 Ripple Ln
- 1003 Park Dr W
- 2550 Highway 82 Unit D204
- 102 County Road 156
- TBD County Road 117
- 160 Maroon Dr
- 3114 S Grand Ave Unit S Grand Avenue
- 117 County Road 132
- 2701 Midland Ave Unit 725
- 2701 Midland Ave Unit 727
- 2701 Midland Ave Unit 1125
- 2701 Midland Ave Unit 1111
- 2701 Midland Ave Unit 511
- TBD Colorado 82
- 3800 Old Lodge Rd Unit 2B
- 3800 Old Lodge Rd Unit 1G
- 3800 Old Lodge Rd Unit 2C
- 3800 Old Lodge Rd Unit 1C
- 3800 Old Lodge Rd Unit 1F
- 3800 Old Lodge Rd Unit 4C
- 3800 Old Lodge Rd Unit 1H
- 3800 Old Lodge Rd Unit 2A
- 3800 Old Lodge Rd Unit 1E
- 3800 Old Lodge Rd Unit 1B
- 3800 Old Lodge Rd Unit 1A
- 3800 Old Lodge Rd Unit 2H
- 3800 Old Lodge Rd Unit 2F
- 3800 Old Lodge Rd Unit 2E
- 3800 Old Lodge Rd Unit 2D
- 3800 Old Lodge Rd Unit 3A
- 3800 Old Lodge Rd Unit 4D
- 3800 Old Lodge Rd Unit 4B
- 3800 Old Lodge Rd Unit 4A
- 3800 Old Lodge Rd