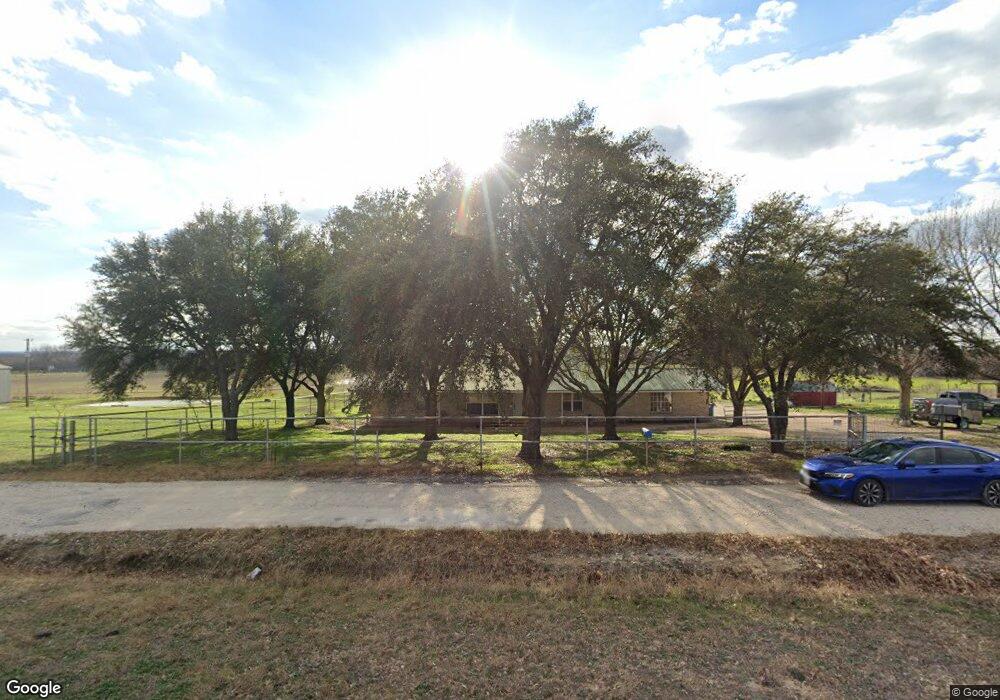
3800 Temple Hall Hwy Granbury, TX 76049
Estimated Value: $406,000 - $684,000
4
Beds
3
Baths
2,264
Sq Ft
$246/Sq Ft
Est. Value
About This Home
This home is located at 3800 Temple Hall Hwy, Granbury, TX 76049 and is currently estimated at $557,087, approximately $246 per square foot. 3800 Temple Hall Hwy is a home located in Hood County with nearby schools including Oak Woods School, Acton Middle School, and Granbury High School.
Ownership History
Date
Name
Owned For
Owner Type
Purchase Details
Closed on
Oct 9, 2020
Sold by
Watkins Carla Diane and Monroe Charles C
Bought by
Balderas Jose and Balderas Kristy Cruz
Current Estimated Value
Home Financials for this Owner
Home Financials are based on the most recent Mortgage that was taken out on this home.
Original Mortgage
$280,330
Outstanding Balance
$248,774
Interest Rate
2.9%
Mortgage Type
New Conventional
Estimated Equity
$308,313
Purchase Details
Closed on
Sep 22, 2015
Sold by
Monroe Charles C and Monroe Catherine L
Bought by
Watkins Carla Diane and Monroe Charles Earl
Purchase Details
Closed on
Jun 9, 1989
Sold by
Monroe Glenn
Bought by
Watkins Carla D Monroe Charles E and Monroe Curtis
Purchase Details
Closed on
Dec 13, 1988
Sold by
Monroe Charles C and Monroe Catherine
Bought by
Watkins Carla D Monroe Charles E and Monroe Curtis
Create a Home Valuation Report for This Property
The Home Valuation Report is an in-depth analysis detailing your home's value as well as a comparison with similar homes in the area
Home Values in the Area
Average Home Value in this Area
Purchase History
| Date | Buyer | Sale Price | Title Company |
|---|---|---|---|
| Balderas Jose | -- | Porter Title Co | |
| Watkins Carla Diane | -- | Attorney | |
| Watkins Carla D Monroe Charles E | -- | -- | |
| Watkins Carla D Monroe Charles E | -- | -- |
Source: Public Records
Mortgage History
| Date | Status | Borrower | Loan Amount |
|---|---|---|---|
| Open | Balderas Jose | $280,330 |
Source: Public Records
Tax History Compared to Growth
Tax History
| Year | Tax Paid | Tax Assessment Tax Assessment Total Assessment is a certain percentage of the fair market value that is determined by local assessors to be the total taxable value of land and additions on the property. | Land | Improvement |
|---|---|---|---|---|
| 2025 | $3,661 | $398,320 | $0 | $0 |
| 2024 | $3,383 | $362,109 | $0 | $0 |
| 2023 | $4,006 | $395,660 | $145,040 | $250,620 |
| 2022 | $3,582 | $299,270 | $82,880 | $216,390 |
| 2021 | $4,080 | $265,800 | $82,880 | $182,920 |
| 2020 | $2,881 | $185,490 | $82,880 | $102,610 |
| 2019 | $3,018 | $185,630 | $82,880 | $102,750 |
| 2018 | $2,524 | $155,240 | $58,020 | $97,220 |
| 2017 | $2,369 | $141,680 | $58,020 | $83,660 |
| 2016 | $2,348 | $140,440 | $52,810 | $87,630 |
| 2015 | $1,041 | $93,710 | $24,000 | $69,710 |
| 2014 | $1,041 | $106,940 | $14,000 | $92,940 |
Source: Public Records
Map
Nearby Homes
- 4301 Monroe Hwy
- 1824 Nutt Grove Ct
- 5600 Temple Hall Hwy
- 4618 Aberdeen Dr
- 423 Creekside Ct
- 959 M And m Ranch Rd
- 3917 Country Meadows Cir
- 367 Lake Country Dr
- 2208 Beau West Ct
- 2214 Tree Top Ct
- 130 Atwood Rd
- 3365 Crook Ct
- 1716 Bent Tree Ct
- 2901 Space Ct
- 5728 N Sunchase Dr
- 5482 Sun Meadow Cir
- 391 Gina Cir
- 821 Williamson Rd
- 4010 Quail Ridge Ct
- 3305 Bounty Dr
- 3801 Temple Hall Hwy
- 3804 Temple Hall Hwy
- 3815 Temple Hall Hwy
- 3314 Everidge Ct
- 3609 Temple Hall Hwy
- 3550 Temple Hall Hwy
- 3600 Temple Hall Hwy
- 3491 Temple Hall Hwy
- 3485 Temple Hall Hwy
- 3379 Temple Hall Hwy
- 3500 Temple Hall Hwy
- 3321 Temple Hall Hwy
- 4200 Temple Hall Hwy
- 4501 Spider Ct
- 3504 Temple Hall Hwy
- 2611 Boyd Rd
- 2301 Boyd Rd
- 4541 Spider Ct
- 2615 Boyd Rd
- 2901 Temple Hall Hwy