Estimated Value: $333,000 - $466,000
6
Beds
4
Baths
2,872
Sq Ft
$138/Sq Ft
Est. Value
About This Home
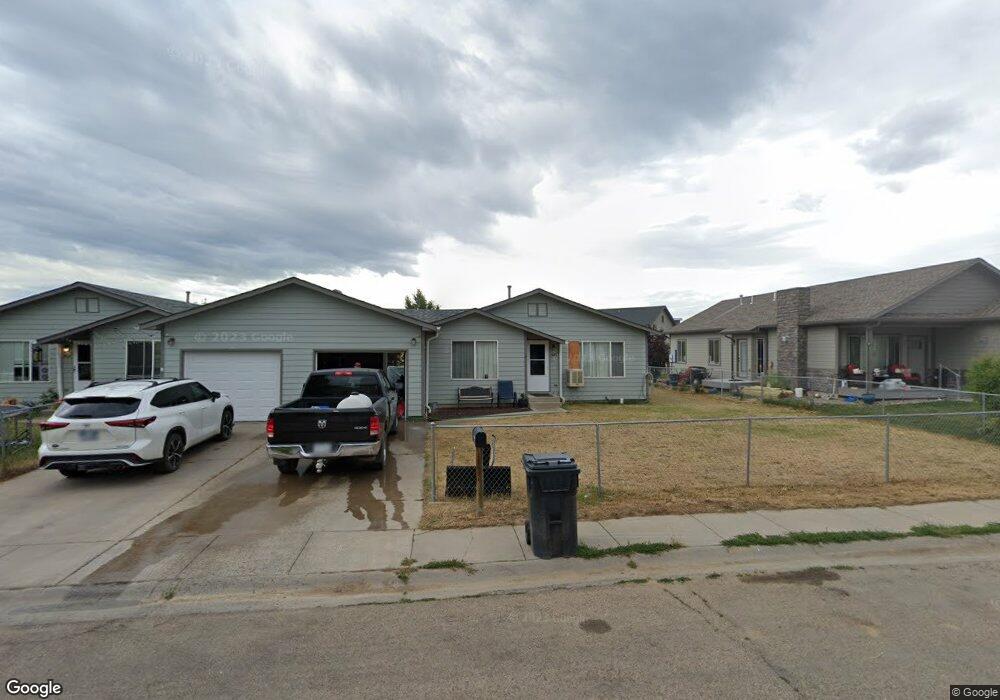
This home is located at 3800 W 6th St, Craig, CO 81625 and is currently estimated at $395,357, approximately $137 per square foot. 3800 W 6th St is a home located in Moffat County with nearby schools including Ridgeview Elementary School, Moffat County High School, and Calvary Baptist School.
Ownership History
Date
Name
Owned For
Owner Type
Purchase Details
Closed on
May 31, 2023
Sold by
Burns David J
Bought by
Thompson Christalin
Current Estimated Value
Home Financials for this Owner
Home Financials are based on the most recent Mortgage that was taken out on this home.
Original Mortgage
$366,300
Outstanding Balance
$354,532
Interest Rate
6.39%
Mortgage Type
FHA
Estimated Equity
$40,825
Purchase Details
Closed on
Oct 19, 2020
Sold by
Hansband Katy L and Burns David J
Bought by
Burns Kathy L and Burns David J
Home Financials for this Owner
Home Financials are based on the most recent Mortgage that was taken out on this home.
Original Mortgage
$202,500
Interest Rate
2.8%
Mortgage Type
New Conventional
Purchase Details
Closed on
Oct 1, 2015
Sold by
Rodewald Jay H and Rodewald Jennifer
Bought by
Husband Katy L and Burns David J
Home Financials for this Owner
Home Financials are based on the most recent Mortgage that was taken out on this home.
Original Mortgage
$216,015
Interest Rate
3.85%
Mortgage Type
FHA
Create a Home Valuation Report for This Property
The Home Valuation Report is an in-depth analysis detailing your home's value as well as a comparison with similar homes in the area
Purchase History
| Date | Buyer | Sale Price | Title Company |
|---|---|---|---|
| Thompson Christalin | $390,000 | None Listed On Document | |
| Burns Kathy L | -- | None Available | |
| Husband Katy L | $220,000 | None Available | |
| Rodewald Jay H | -- | None Available |
Source: Public Records
Mortgage History
| Date | Status | Borrower | Loan Amount |
|---|---|---|---|
| Open | Thompson Christalin | $366,300 | |
| Previous Owner | Burns Kathy L | $202,500 | |
| Previous Owner | Husband Katy L | $216,015 |
Source: Public Records
Tax History
| Year | Tax Paid | Tax Assessment Tax Assessment Total Assessment is a certain percentage of the fair market value that is determined by local assessors to be the total taxable value of land and additions on the property. | Land | Improvement |
|---|---|---|---|---|
| 2025 | $2,218 | $24,157 | $0 | $0 |
| 2024 | $2,218 | $19,386 | $0 | $0 |
| 2023 | $1,682 | $18,257 | $1,854 | $16,403 |
| 2022 | $1,594 | $18,915 | $2,261 | $16,654 |
| 2021 | $1,647 | $19,890 | $2,380 | $17,510 |
| 2020 | $1,569 | $19,190 | $2,380 | $16,810 |
| 2019 | $1,554 | $19,190 | $2,380 | $16,810 |
| 2018 | $1,386 | $17,030 | $2,390 | $14,640 |
| 2017 | $1,429 | $17,030 | $2,390 | $14,640 |
| 2016 | $1,600 | $19,710 | $2,650 | $17,060 |
| 2015 | $1,508 | $19,710 | $2,650 | $17,060 |
| 2013 | $1,508 | $18,320 | $2,650 | $15,670 |
Source: Public Records
Map
Nearby Homes
- TBD W 6th St
- 3821 W 6th St
- 3865 W 6th St
- TBD Hwy 40
- TBD Wickes Ave
- 3435 Lenox Rd
- TBD Crescent Dr & Riford Rd
- TBD Highway 40
- 676 Overlook Dr
- TBD W Victory Way 6 66 Acres
- TBD County Road 30
- 198 Cedar Ct
- 2928 Pinon Cir
- 2773 W 1st St
- TBD Pinon Cir
- TBD S Highway 13 1 32 Acres
- 1280 Sunrise Ln
- 1213 Sunrise Ln
- 2110 Alder Place
- 2210 W 3rd St Unit 38
- 3800/3820 W 6th St
- 3800 W 6th St
- 3800 W 6th St Unit 3820 W 6th Street
- 3820 W 6th St
- 3834 W 6th St
- 3817 W 6th St
- 1320 County Rd Unit 7
- 3805 W 6th St
- 3829 W 6th St
- 3833 W 6th St
- 3839 W 6th St
- 3846 W 6th St
- 3845 W 6th St
- 3797 W 6th St
- 3797 W 6th St Unit WEST
- 3852 W 6th St
- 3851 W 6th St
- 3793 W 6th St
- 3857 W 6th St
- 3791 W 6th St
Your Personal Tour Guide
Ask me questions while you tour the home.