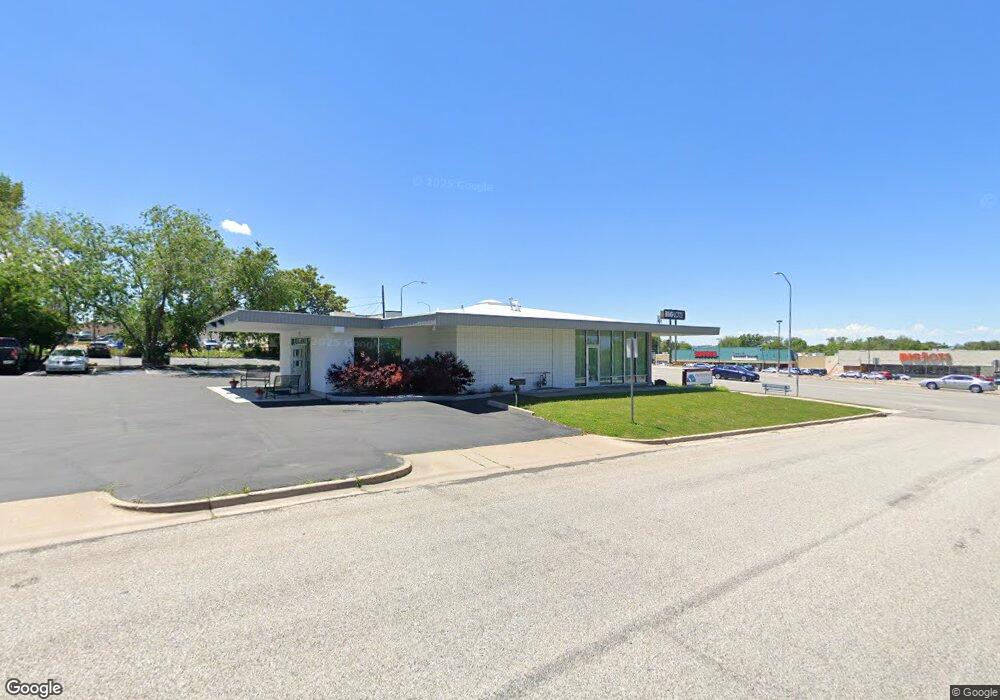
3800 Washington Blvd South Ogden, UT 84403
Estimated Value: $908,794
--
Bed
--
Bath
2,645
Sq Ft
$344/Sq Ft
Est. Value
About This Home
This home is located at 3800 Washington Blvd, South Ogden, UT 84403 and is currently estimated at $908,794, approximately $343 per square foot. 3800 Washington Blvd is a home located in Weber County with nearby schools including Burch Creek School, South Ogden Junior High School, and Bonneville High School.
Ownership History
Date
Name
Owned For
Owner Type
Purchase Details
Closed on
May 9, 2014
Sold by
Long King Investments Llc
Bought by
Myers Investment Properties Llc
Current Estimated Value
Home Financials for this Owner
Home Financials are based on the most recent Mortgage that was taken out on this home.
Original Mortgage
$435,000
Outstanding Balance
$332,140
Interest Rate
4.38%
Mortgage Type
Commercial
Estimated Equity
$576,654
Purchase Details
Closed on
Feb 23, 2005
Sold by
Yu King Long
Bought by
Long King Investments Llc
Purchase Details
Closed on
Jul 31, 2001
Sold by
First Security Bank Of Utah
Bought by
Stanzione Rick and The R&R Stanzione Family Trust
Home Financials for this Owner
Home Financials are based on the most recent Mortgage that was taken out on this home.
Original Mortgage
$188,509
Interest Rate
7.1%
Mortgage Type
Commercial
Create a Home Valuation Report for This Property
The Home Valuation Report is an in-depth analysis detailing your home's value as well as a comparison with similar homes in the area
Home Values in the Area
Average Home Value in this Area
Purchase History
| Date | Buyer | Sale Price | Title Company |
|---|---|---|---|
| Myers Investment Properties Llc | -- | Us Title Insurance Agency | |
| Long King Investments Llc | -- | Us Title | |
| Stanzione Rick | -- | Associated Title |
Source: Public Records
Mortgage History
| Date | Status | Borrower | Loan Amount |
|---|---|---|---|
| Open | Myers Investment Properties Llc | $435,000 | |
| Previous Owner | Stanzione Rick | $188,509 |
Source: Public Records
Tax History Compared to Growth
Tax History
| Year | Tax Paid | Tax Assessment Tax Assessment Total Assessment is a certain percentage of the fair market value that is determined by local assessors to be the total taxable value of land and additions on the property. | Land | Improvement |
|---|---|---|---|---|
| 2025 | $6,568 | $545,000 | $239,044 | $305,956 |
| 2024 | $6,246 | $529,000 | $267,188 | $261,812 |
| 2023 | $5,806 | $504,000 | $267,188 | $236,812 |
| 2022 | $5,774 | $504,000 | $249,375 | $254,625 |
| 2021 | $5,356 | $436,000 | $213,750 | $222,250 |
| 2020 | $5,443 | $415,487 | $213,750 | $201,737 |
| 2019 | $5,183 | $378,000 | $142,500 | $235,500 |
| 2018 | $5,234 | $360,000 | $142,500 | $217,500 |
| 2017 | $5,169 | $342,721 | $128,250 | $214,471 |
| 2016 | $4,876 | $328,471 | $114,000 | $214,471 |
| 2015 | $4,784 | $314,440 | $114,000 | $200,440 |
| 2014 | $3,281 | $206,640 | $142,500 | $64,140 |
Source: Public Records
Map
Nearby Homes
- 3756 Ogden Ave
- 356 39th St
- 965 E 39th St
- 314 38th St
- 326 E 39th St
- 516 Diana St
- 315 39th St
- 26 Sylvia Dr
- 302 40th St
- 225 Chimes View Cir
- 575 40th St
- 3596 Adams Ave
- 3567 Adams Ave
- 239 E Burch Creek Place
- 241 E Burch Creek Place
- 3874 Orchard Ave
- 215 40th St
- 4022 S Burch Creek Way
- 4042 Porter Ave
- 260 36th St
- 3848 Washington Blvd
- 3805 Ogden Ave
- 3807 Ogden Ave
- 3791 Ogden Ave
- 3850 Washington Blvd
- 3850 Washington Blvd
- 3809 Ogden Ave
- 3775 Ogden Ave
- 3772 Washington Blvd
- 3811 Ogden Ave
- 3773 Ogden Ave
- 3813 Ogden Ave
- 3756 Washington Blvd
- 3860 Washington Blvd
- 3800 Ogden Ave
- 3806 Ogden Ave
- 3819 Ogden Ave
- 3755 Ogden Ave
- 3810 Ogden Ave
- 3780 Ogden Ave