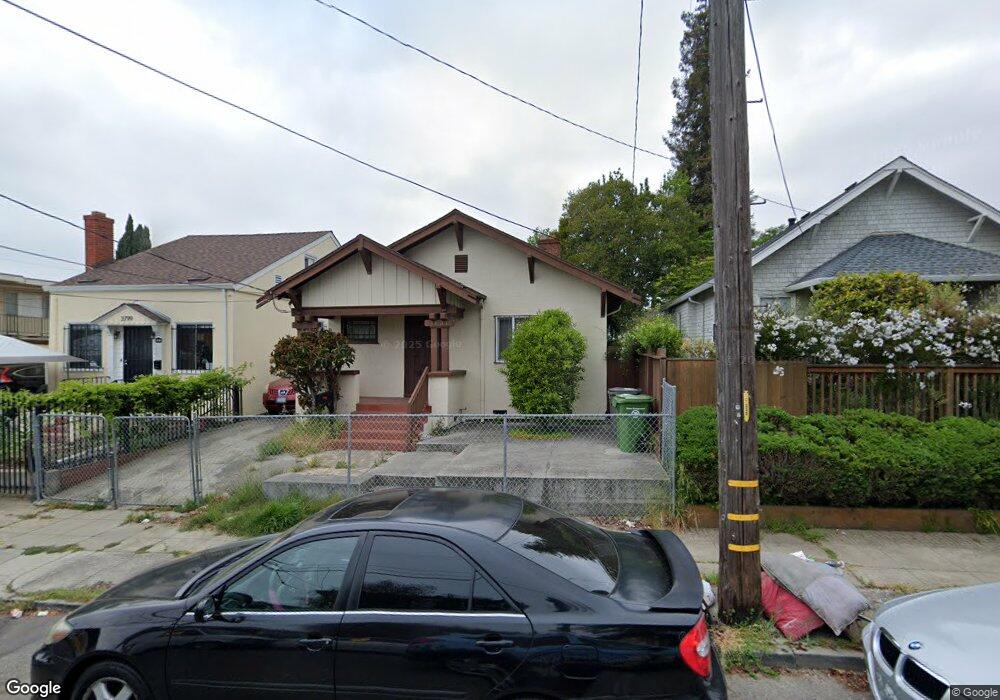
3801 39th Ave Oakland, CA 94619
Laurel NeighborhoodEstimated Value: $632,000 - $711,000
2
Beds
1
Bath
1,285
Sq Ft
$510/Sq Ft
Est. Value
About This Home
This home is located at 3801 39th Ave, Oakland, CA 94619 and is currently estimated at $655,767, approximately $510 per square foot. 3801 39th Ave is a home located in Alameda County with nearby schools including Laurel Elementary School, Bret Harte Middle School, and Skyline High School.
Ownership History
Date
Name
Owned For
Owner Type
Purchase Details
Closed on
Mar 3, 2005
Sold by
Shum Kirby
Bought by
Shum Kirby and Kirby Shum Revocable Trust
Current Estimated Value
Home Financials for this Owner
Home Financials are based on the most recent Mortgage that was taken out on this home.
Original Mortgage
$80,000
Interest Rate
5.61%
Mortgage Type
New Conventional
Purchase Details
Closed on
Sep 28, 1998
Sold by
Shum Kirby
Bought by
Shum Kirby and Kirby Shum Revocable Trust
Create a Home Valuation Report for This Property
The Home Valuation Report is an in-depth analysis detailing your home's value as well as a comparison with similar homes in the area
Home Values in the Area
Average Home Value in this Area
Purchase History
We collect this data history from publicly available records. To have your information removed, we recommend requesting removal directly through your county’s website.
| Date | Buyer | Sale Price | Title Company |
|---|---|---|---|
| Shum Kirby | -- | Chicago Title Co | |
| Shum Kirby | -- | Chicago Title Co | |
| Shum Kirby | -- | -- |
Source: Public Records
Mortgage History
We collect this data history from publicly available records. To have your information removed, we recommend requesting removal directly through your county’s website.
| Date | Status | Borrower | Loan Amount |
|---|---|---|---|
| Closed | Shum Kirby | $80,000 |
Source: Public Records
Tax History
| Year | Tax Paid | Tax Assessment Tax Assessment Total Assessment is a certain percentage of the fair market value that is determined by local assessors to be the total taxable value of land and additions on the property. | Land | Improvement |
|---|---|---|---|---|
| 2025 | $3,787 | $156,987 | $103,126 | $60,861 |
| 2024 | $3,787 | $153,772 | $101,104 | $59,668 |
| 2023 | $3,864 | $157,620 | $99,122 | $58,498 |
| 2022 | $3,699 | $147,530 | $97,179 | $57,351 |
| 2021 | $3,402 | $144,501 | $95,274 | $56,227 |
| 2020 | $3,362 | $149,948 | $94,297 | $55,651 |
| 2019 | $3,150 | $147,009 | $92,449 | $54,560 |
| 2018 | $3,086 | $144,126 | $90,636 | $53,490 |
| 2017 | $2,936 | $141,300 | $88,859 | $52,441 |
| 2016 | $2,757 | $138,530 | $87,117 | $51,413 |
| 2015 | $2,737 | $136,450 | $85,809 | $50,641 |
| 2014 | $2,668 | $133,777 | $84,128 | $49,649 |
Source: Public Records
Map
Nearby Homes
- 3824 39th Ave Unit C
- 3758 Patterson Ave
- 3654 39th Ave
- 3932 Macarthur Blvd
- 3661 Loma Vista Ave
- 3872 35th Ave
- 3918 High St
- 3434 California St
- 3422 Kansas St
- 4471 Tulip Ave
- 4239 Quigley Place
- 3600 Quigley St
- 3626 Midvale Ave
- 3514 Libby Ct
- 3933 Midvale Ave
- 4251 Porter St
- 4538 Tulip Ave
- 4475 Redding St
- 4206 Huntington St
- 3316 Macarthur Blvd
Your Personal Tour Guide
Ask me questions while you tour the home.