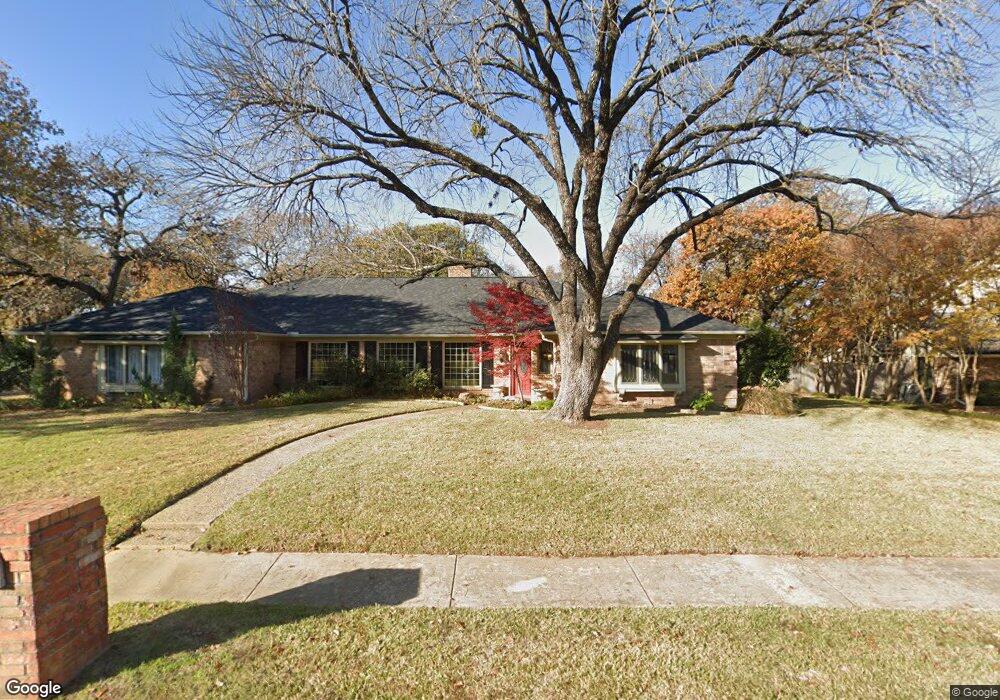
3801 Cambridge Cir W Bedford, TX 76021
Estimated Value: $576,000 - $635,000
4
Beds
3
Baths
2,627
Sq Ft
$229/Sq Ft
Est. Value
About This Home
This home is located at 3801 Cambridge Cir W, Bedford, TX 76021 and is currently estimated at $602,834, approximately $229 per square foot. 3801 Cambridge Cir W is a home located in Tarrant County with nearby schools including Spring Garden Elementary School, Harwood Junior High School, and Trinity High School.
Ownership History
Date
Name
Owned For
Owner Type
Purchase Details
Closed on
Jul 19, 2002
Sold by
Cheville Jon P and Cheville Jody K
Bought by
Quincey Edgar J and Quincey Lynn D
Current Estimated Value
Home Financials for this Owner
Home Financials are based on the most recent Mortgage that was taken out on this home.
Original Mortgage
$244,800
Outstanding Balance
$103,628
Interest Rate
6.69%
Mortgage Type
VA
Estimated Equity
$499,206
Purchase Details
Closed on
May 15, 1997
Sold by
Neely David Leland and Neely Judy L
Bought by
Cheville Jon P and Cheville Jody K
Home Financials for this Owner
Home Financials are based on the most recent Mortgage that was taken out on this home.
Original Mortgage
$172,350
Interest Rate
8.12%
Mortgage Type
Balloon
Create a Home Valuation Report for This Property
The Home Valuation Report is an in-depth analysis detailing your home's value as well as a comparison with similar homes in the area
Home Values in the Area
Average Home Value in this Area
Purchase History
| Date | Buyer | Sale Price | Title Company |
|---|---|---|---|
| Quincey Edgar J | -- | -- | |
| Cheville Jon P | -- | Alamo Title Co |
Source: Public Records
Mortgage History
| Date | Status | Borrower | Loan Amount |
|---|---|---|---|
| Open | Quincey Edgar J | $244,800 | |
| Previous Owner | Cheville Jon P | $172,350 | |
| Closed | Cheville Jon P | $34,470 |
Source: Public Records
Tax History Compared to Growth
Tax History
| Year | Tax Paid | Tax Assessment Tax Assessment Total Assessment is a certain percentage of the fair market value that is determined by local assessors to be the total taxable value of land and additions on the property. | Land | Improvement |
|---|---|---|---|---|
| 2025 | $7,914 | $322,812 | $130,000 | $192,812 |
| 2024 | $7,914 | $520,664 | $130,000 | $390,664 |
| 2023 | $7,179 | $528,496 | $90,000 | $438,496 |
| 2022 | $8,614 | $441,211 | $90,000 | $351,211 |
| 2021 | $8,445 | $358,523 | $90,000 | $268,523 |
| 2020 | $8,575 | $360,648 | $90,000 | $270,648 |
| 2019 | $8,771 | $361,032 | $90,000 | $271,032 |
| 2018 | $7,621 | $329,432 | $90,000 | $239,432 |
| 2017 | $7,757 | $346,017 | $50,000 | $296,017 |
| 2016 | $7,052 | $330,630 | $50,000 | $280,630 |
| 2015 | $6,380 | $265,000 | $35,000 | $230,000 |
| 2014 | $6,380 | $265,000 | $35,000 | $230,000 |
Source: Public Records
Map
Nearby Homes
- 3827 Ashbury Ln
- 1820 Wimbleton Dr
- 1800 Hampton Dr
- 1209 Hillandale Ct
- 1136 Wingate Dr
- 3907 Windermere Dr
- 3301 Wendover Ct
- 1421 Plantation Dr N
- 1303 Crest Dr
- 1109 Simpson Terrace
- 3513 Meadowside Dr
- 3907 Copperwood Ct
- 3532 Meadowside Dr
- 2209 Laurel Ct
- 1636 Bedford Oaks Dr
- 2204 Woodstock Dr
- 4002 Copperwood Ct
- 1704 Indian Oaks Ct
- 3813 Brookridge Ct
- 3840 Edgewater Dr
- 3805 Cambridge Cir W
- 1701 Wimbleton Dr
- 3809 Cambridge Cir W
- 1605 Wimbleton Dr
- 3804 Cambridge Cir W
- 1612 Wimbleton Dr
- 1604 Wimbleton Dr
- 1616 Wimbleton Dr
- 3808 Cambridge Cir W
- 3813 Cambridge Cir W
- 1700 Wimbleton Dr
- 3700 Wimberly Dr
- 1705 Wimbleton Dr
- 3812 Cambridge Cir W
- 3805 Cambridge Cir E
- 1413 Wedglea Ct
- 3704 Wimberly Dr
- 1412 Wedglea Ct
- 1704 Wimbleton Dr
- 3809 Cambridge Cir E