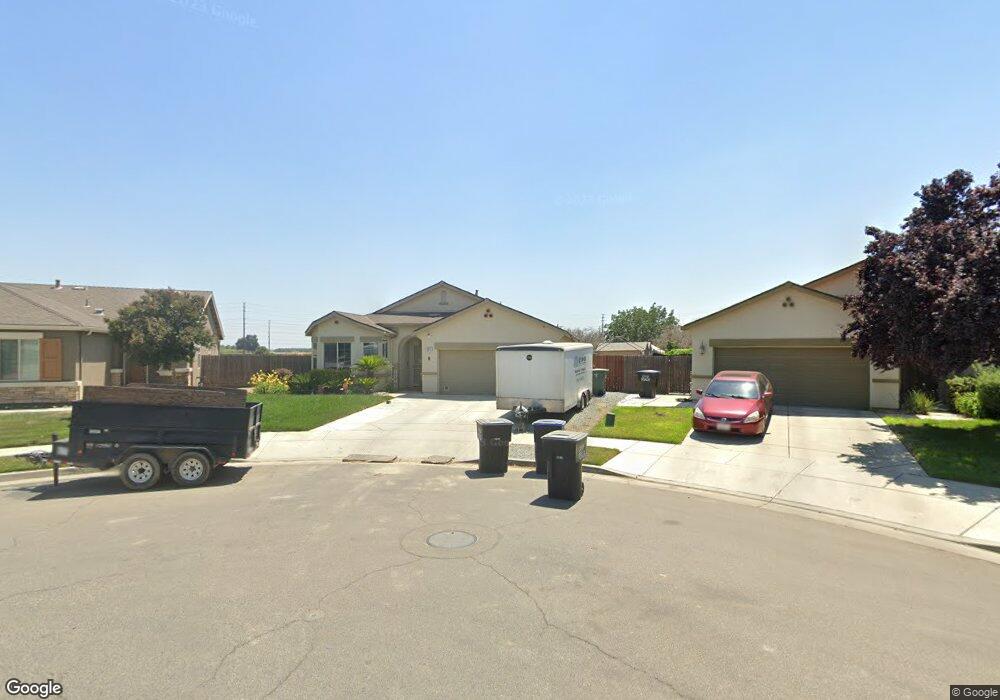
3801 E Country Ave Visalia, CA 93292
Southeast Visalia NeighborhoodEstimated Value: $400,000 - $467,000
3
Beds
2
Baths
1,767
Sq Ft
$240/Sq Ft
Est. Value
About This Home
This home is located at 3801 E Country Ave, Visalia, CA 93292 and is currently estimated at $424,753, approximately $240 per square foot. 3801 E Country Ave is a home with nearby schools including Annie R. Mitchell Elementary School, Divisadero Middle School, and Mt. Whitney High School.
Ownership History
Date
Name
Owned For
Owner Type
Purchase Details
Closed on
Apr 27, 2023
Sold by
Harold Dean Clements and Harold Leona Justice
Bought by
Roberts Lee M and Cesena David
Current Estimated Value
Purchase Details
Closed on
Sep 26, 2016
Sold by
Roberts Lee M
Bought by
Roberts Lee M and Cesena David
Home Financials for this Owner
Home Financials are based on the most recent Mortgage that was taken out on this home.
Original Mortgage
$196,000
Interest Rate
3.43%
Mortgage Type
New Conventional
Purchase Details
Closed on
Mar 29, 2011
Sold by
Woodside 06N Lp
Bought by
Roberts Lee M
Home Financials for this Owner
Home Financials are based on the most recent Mortgage that was taken out on this home.
Original Mortgage
$209,124
Interest Rate
4.5%
Mortgage Type
FHA
Create a Home Valuation Report for This Property
The Home Valuation Report is an in-depth analysis detailing your home's value as well as a comparison with similar homes in the area
Home Values in the Area
Average Home Value in this Area
Purchase History
| Date | Buyer | Sale Price | Title Company |
|---|---|---|---|
| Roberts Lee M | -- | None Listed On Document | |
| Roberts Lee M | -- | Chicago Title Company | |
| Roberts Lee M | $212,000 | Placer Title Company |
Source: Public Records
Mortgage History
| Date | Status | Borrower | Loan Amount |
|---|---|---|---|
| Previous Owner | Roberts Lee M | $196,000 | |
| Previous Owner | Roberts Lee M | $209,124 |
Source: Public Records
Tax History
| Year | Tax Paid | Tax Assessment Tax Assessment Total Assessment is a certain percentage of the fair market value that is determined by local assessors to be the total taxable value of land and additions on the property. | Land | Improvement |
|---|---|---|---|---|
| 2025 | $3,313 | $275,007 | $88,362 | $186,645 |
| 2024 | $3,313 | $269,616 | $86,630 | $182,986 |
| 2023 | $3,233 | $264,331 | $84,932 | $179,399 |
| 2022 | $3,107 | $259,149 | $83,267 | $175,882 |
| 2021 | $3,111 | $254,067 | $81,634 | $172,433 |
| 2020 | $3,092 | $251,462 | $80,797 | $170,665 |
| 2019 | $3,018 | $246,532 | $79,213 | $167,319 |
| 2018 | $2,950 | $241,698 | $77,660 | $164,038 |
| 2017 | $2,827 | $233,000 | $58,000 | $175,000 |
| 2016 | $2,647 | $213,000 | $53,000 | $160,000 |
| 2015 | $2,516 | $200,000 | $50,000 | $150,000 |
| 2014 | $2,379 | $185,000 | $46,000 | $139,000 |
Source: Public Records
Map
Nearby Homes
- 3650 E Cherry Ave
- 3540 E Cherry Ave
- 2254 S Lebec St
- 3623 E Seeger Ave
- 3827 E Harter Ct
- 3516 E Seeger Ave
- 2431 S Manzanita St
- 2421 S Manzanita St
- 2410 S Manzanita St
- 2501 S Manzanita St
- 2441 S Manzanita St Unit 95 Pw
- 2501 S Manzanita St Unit 94 Pw
- 2441 S Manzanita St
- 2227 S Crumal St
- 2207 S Crumal St
- 3219 E Mary Ave
- 3947 E Cambridge Ave
- 3118 E Country Ave
- 2233 S Aubree St
- 3403 E Vassar Ct
- 3811 E Country Ave
- 2523 S Elverta St
- 3817 E Country Ave
- 2511 S Elverta St
- 3831 E Country Ave
- 2501 S Elverta St
- 3812 E Country Ave
- 3847 E Country Ave
- 3820 E Country Ave
- 2447 S Elverta St
- 3832 E Country Ave
- 2448 S Laguna Ct
- 3807 E Evergreen Ave
- 2437 S Elverta St
- 3848 E Country Ave
- 3821 E Evergreen Ave
- 2440 S Laguna Ct
- 3835 E Evergreen Ave
- 3909 E Country Ave
- 2431 S Elverta St
Your Personal Tour Guide
Ask me questions while you tour the home.