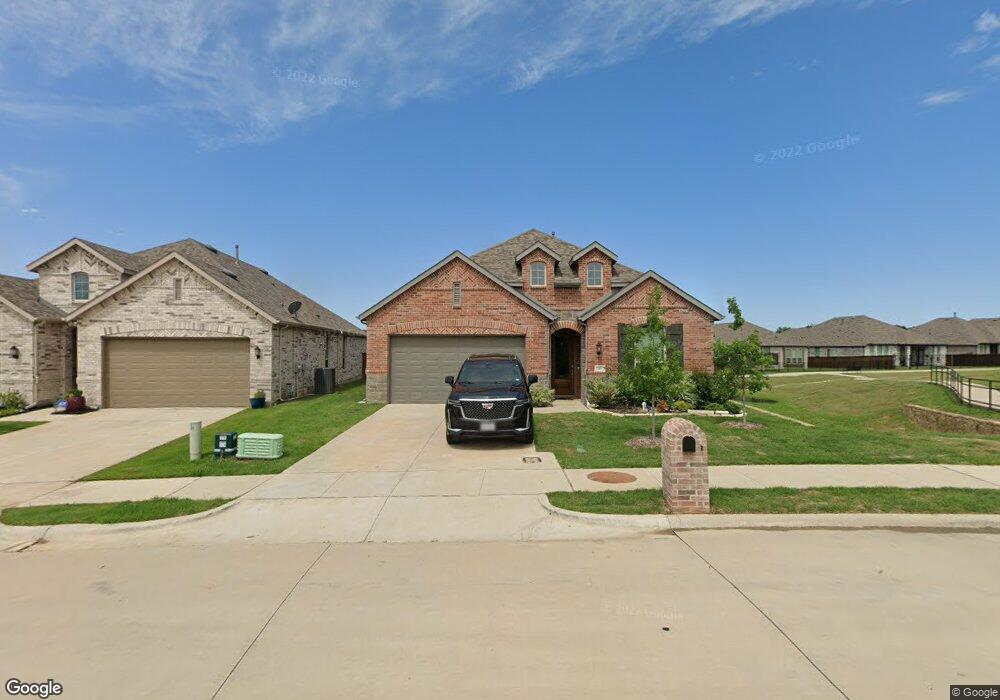
3801 Iron Ore Dr Denison, TX 75020
Estimated Value: $405,704 - $418,000
--
Bed
--
Bath
2,130
Sq Ft
$193/Sq Ft
Est. Value
About This Home
This home is located at 3801 Iron Ore Dr, Denison, TX 75020 and is currently estimated at $411,852, approximately $193 per square foot. 3801 Iron Ore Dr is a home with nearby schools including Hyde Park Elementary School, Scott Middle School, and Denison High School.
Ownership History
Date
Name
Owned For
Owner Type
Purchase Details
Closed on
May 26, 2023
Sold by
Kincannon Shawn Michael and Kincannon Hilary Rose
Bought by
Fisher Eddie and Fisher Vannah
Current Estimated Value
Home Financials for this Owner
Home Financials are based on the most recent Mortgage that was taken out on this home.
Original Mortgage
$405,000
Outstanding Balance
$394,544
Interest Rate
7%
Mortgage Type
New Conventional
Estimated Equity
$17,308
Purchase Details
Closed on
Jun 10, 2021
Sold by
Franks Jonathan G and Franks Kathryn
Bought by
Kincannon Sshawnn M
Purchase Details
Closed on
Nov 25, 2019
Sold by
Caston Doris C
Bought by
Kincannon Shawn Michael and Kincannon Hilary Rose
Purchase Details
Closed on
Aug 21, 2019
Sold by
Higland Homes Dalls Llc
Bought by
Caston Doris C
Purchase Details
Closed on
Mar 25, 2019
Sold by
Tpj Properties Ltd
Bought by
Highland Homes Dallas Llc
Create a Home Valuation Report for This Property
The Home Valuation Report is an in-depth analysis detailing your home's value as well as a comparison with similar homes in the area
Home Values in the Area
Average Home Value in this Area
Purchase History
| Date | Buyer | Sale Price | Title Company |
|---|---|---|---|
| Fisher Eddie | -- | Red River Title | |
| Kincannon Sshawnn M | -- | Red River Title Co | |
| Kincannon Shawn Michael | -- | Red River Title Co | |
| Caston Doris C | -- | None Available | |
| Highland Homes Dallas Llc | -- | Old Republic Title |
Source: Public Records
Mortgage History
| Date | Status | Borrower | Loan Amount |
|---|---|---|---|
| Open | Fisher Eddie | $405,000 |
Source: Public Records
Tax History Compared to Growth
Tax History
| Year | Tax Paid | Tax Assessment Tax Assessment Total Assessment is a certain percentage of the fair market value that is determined by local assessors to be the total taxable value of land and additions on the property. | Land | Improvement |
|---|---|---|---|---|
| 2025 | $6,055 | $443,934 | $41,175 | $402,759 |
| 2024 | $10,732 | $461,940 | $43,736 | $418,204 |
| 2023 | $6,129 | $444,830 | $43,736 | $401,094 |
| 2022 | $8,804 | $370,535 | $0 | $0 |
| 2021 | $7,667 | $304,000 | $39,730 | $264,270 |
| 2020 | $7,839 | $297,176 | $39,730 | $257,446 |
| 2019 | $550 | $19,984 | $19,984 | $0 |
Source: Public Records
Map
Nearby Homes
- 3827 Fawn Meadow Trail
- 3836 Iron Ore Dr
- 3806 Deer Point Dr
- 3717 Fawn Meadow Trail
- 3720 Parkwood Ln
- 3705 Magnolia Ct
- 3805 Saddle Creek
- 3514 Vision Ridge Trail
- 3811 Saddle Creek
- 3647 Rosewood Dr
- 3658 Rosewood Dr
- 3711 Parkwood Ln
- 186 Acorn Trail
- 3625 Rosewood
- 3900 Saddle Creek
- 4154 Carter Ct
- 4159 Carter Ct
- 820 U S 75
- 3913 Nature Ct
- 3016 Loy Lake Rd
- 3805 Iron Ore Dr
- 3809 Iron Ore Dr
- 3729 Fawn Meadow Trail
- 3716 Bridlewood Trail
- 3813 Iron Ore Dr
- 3804 Iron Ore Dr
- 3714 Bridlewood Trail
- 3725 Fawn Meadow Trail
- 3801 Fawn Meadow Trail
- 3718 Bridlewood Trail
- 3712 Bridlewood Trail
- 3810 Iron Ore Dr
- 3819 Iron Ore Dr
- 3814 Iron Ore Dr
- 3721 Fawn Meadow Trail
- 3720 Bridlewood Trail
- 3817 Iron Ore Dr
- 3805 Fawn Meadow Trail
- 3820 Iron Ore Dr
- 3710 Bridlewood Trail