Estimated Value: $321,000 - $358,948
3
Beds
2
Baths
1,440
Sq Ft
$238/Sq Ft
Est. Value
About This Home
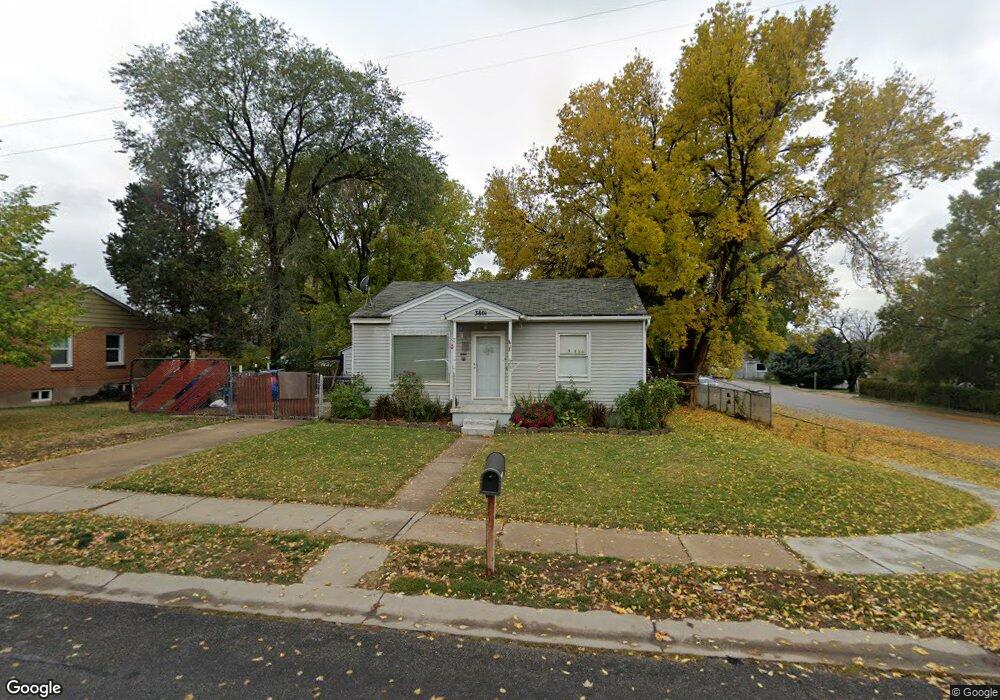
This home is located at 3801 Jefferson Ave, Ogden, UT 84403 and is currently estimated at $343,237, approximately $238 per square foot. 3801 Jefferson Ave is a home located in Weber County with nearby schools including Burch Creek School, South Ogden Junior High School, and Bonneville High School.
Ownership History
Date
Name
Owned For
Owner Type
Purchase Details
Closed on
May 3, 2004
Sold by
Scott Deborah E
Bought by
Castillo Jonathan T
Current Estimated Value
Home Financials for this Owner
Home Financials are based on the most recent Mortgage that was taken out on this home.
Original Mortgage
$84,000
Outstanding Balance
$38,968
Interest Rate
5.35%
Mortgage Type
Purchase Money Mortgage
Estimated Equity
$304,269
Purchase Details
Closed on
Sep 29, 1998
Sold by
Broadhead Randy and Broadhead Kris C
Bought by
Scott Deborah E
Home Financials for this Owner
Home Financials are based on the most recent Mortgage that was taken out on this home.
Original Mortgage
$85,500
Interest Rate
6.88%
Purchase Details
Closed on
Jan 12, 1998
Sold by
Broadhead Randy and Broadhead Kris C
Bought by
Broadhead Randy and Broadhead Kris C
Home Financials for this Owner
Home Financials are based on the most recent Mortgage that was taken out on this home.
Original Mortgage
$41,000
Interest Rate
6.61%
Create a Home Valuation Report for This Property
The Home Valuation Report is an in-depth analysis detailing your home's value as well as a comparison with similar homes in the area
Home Values in the Area
Average Home Value in this Area
Purchase History
| Date | Buyer | Sale Price | Title Company |
|---|---|---|---|
| Castillo Jonathan T | -- | Mountain View Title | |
| Scott Deborah E | -- | Old Republic Title | |
| Broadhead Randy | -- | Associated Title |
Source: Public Records
Mortgage History
| Date | Status | Borrower | Loan Amount |
|---|---|---|---|
| Open | Castillo Jonathan T | $84,000 | |
| Previous Owner | Scott Deborah E | $85,500 | |
| Previous Owner | Broadhead Randy | $41,000 |
Source: Public Records
Tax History
| Year | Tax Paid | Tax Assessment Tax Assessment Total Assessment is a certain percentage of the fair market value that is determined by local assessors to be the total taxable value of land and additions on the property. | Land | Improvement |
|---|---|---|---|---|
| 2025 | $2,441 | $182,807 | $58,565 | $124,242 |
| 2024 | $2,288 | $174,349 | $58,565 | $115,784 |
| 2023 | $2,197 | $168,301 | $58,196 | $110,105 |
| 2022 | $2,140 | $169,399 | $47,224 | $122,175 |
| 2021 | $1,735 | $225,998 | $50,713 | $175,285 |
| 2020 | $1,656 | $201,000 | $40,601 | $160,399 |
| 2019 | $1,567 | $180,000 | $32,558 | $147,442 |
| 2018 | $1,445 | $155,999 | $32,558 | $123,441 |
| 2017 | $1,268 | $128,001 | $30,578 | $97,423 |
| 2016 | $1,119 | $61,408 | $16,728 | $44,680 |
| 2015 | $1,102 | $59,204 | $16,728 | $42,476 |
| 2014 | $948 | $48,472 | $16,728 | $31,744 |
Source: Public Records
Map
Nearby Homes
- 3760 Jefferson Ave
- 3874 Orchard Ave
- 668 37th St
- 3858 Ogden Ave
- 3675 Porter Ave
- 3683 Adams Ave
- 3880 Raymond Ave
- 3624 Porter Ave
- 3845 Nordin Ave
- 4014 Porter Ave
- 428 37th St
- 3596 Adams Ave
- 3567 Adams Ave
- 3555 Adams Ave
- 3538 Adams Ave
- 3813 Grandview Dr
- 3868 Grandview Dr
- 612 35th St
- 3878 Grandview Dr
- 3828 Quincy Ave
- 3819 Jefferson Ave
- 3819 Jefferson Ave Unit 6
- 593 38th St
- 598 Leona Dr
- 581 38th St
- 590 Leona Dr
- 3802 Jefferson Ave
- 3818 Jefferson Ave
- 630 38th St
- 3799 Jefferson Ave
- 584 Leona Dr
- 3826 Jefferson Ave
- 569 38th St
- 3798 Jefferson Ave
- 3832 Jefferson Ave
- 572 Leona Dr
- 3771 Jefferson Ave
- 643 38th St
- 3766 Jefferson Ave
- 561 38th St