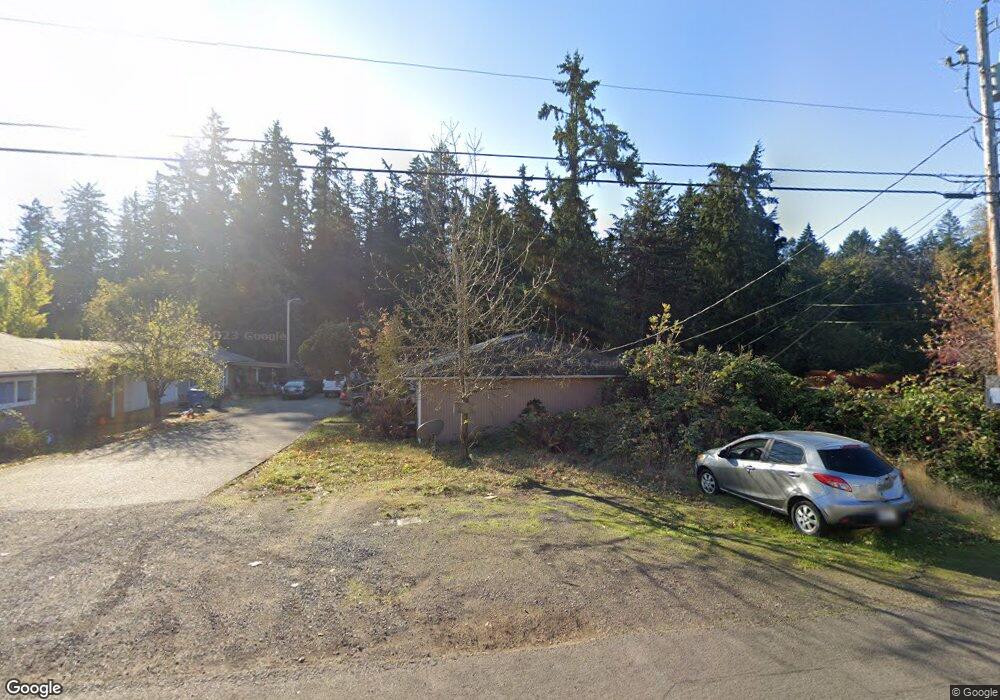
3801 Nicholson Rd Vancouver, WA 98661
Bagley Downs NeighborhoodEstimated Value: $552,000 - $853,000
8
Beds
4
Baths
3,652
Sq Ft
$205/Sq Ft
Est. Value
About This Home
This home is located at 3801 Nicholson Rd, Vancouver, WA 98661 and is currently estimated at $747,313, approximately $204 per square foot. 3801 Nicholson Rd is a home located in Clark County with nearby schools including Roosevelt Elementary School, McLoughlin Middle School, and Fort Vancouver High School.
Ownership History
Date
Name
Owned For
Owner Type
Purchase Details
Closed on
Jan 15, 2025
Sold by
Clarke Brian and Clarke Elizabeth
Bought by
Brian Clarke Living Trust and Clarke
Current Estimated Value
Purchase Details
Closed on
Feb 23, 2011
Sold by
The Secretary Of Housing & Urban Develop
Bought by
Clarke Brian A and Clarke Elizabeth A
Purchase Details
Closed on
Jun 10, 2010
Sold by
Midfirst Bank
Bought by
The Secretary Of Housing & Urban Develop
Purchase Details
Closed on
Jun 9, 2009
Sold by
Orr Kevin M
Bought by
Midfirst Bank
Purchase Details
Closed on
Apr 29, 2004
Sold by
Helgason Catherine M
Bought by
Orr Kevin M
Home Financials for this Owner
Home Financials are based on the most recent Mortgage that was taken out on this home.
Original Mortgage
$260,905
Interest Rate
5.35%
Mortgage Type
FHA
Create a Home Valuation Report for This Property
The Home Valuation Report is an in-depth analysis detailing your home's value as well as a comparison with similar homes in the area
Home Values in the Area
Average Home Value in this Area
Purchase History
| Date | Buyer | Sale Price | Title Company |
|---|---|---|---|
| Brian Clarke Living Trust | -- | None Listed On Document | |
| Clarke Brian A | -- | First American Title | |
| The Secretary Of Housing & Urban Develop | -- | First American Title | |
| Midfirst Bank | $274,047 | First American Title | |
| Orr Kevin M | $265,000 | Clark County Title |
Source: Public Records
Mortgage History
| Date | Status | Borrower | Loan Amount |
|---|---|---|---|
| Previous Owner | Orr Kevin M | $260,905 |
Source: Public Records
Tax History Compared to Growth
Tax History
| Year | Tax Paid | Tax Assessment Tax Assessment Total Assessment is a certain percentage of the fair market value that is determined by local assessors to be the total taxable value of land and additions on the property. | Land | Improvement |
|---|---|---|---|---|
| 2025 | $6,224 | $637,600 | $200,098 | $437,502 |
| 2024 | $5,960 | $637,600 | $200,098 | $437,502 |
| 2023 | $5,398 | $579,600 | $181,907 | $397,693 |
| 2022 | $4,739 | $579,600 | $181,907 | $397,693 |
| 2021 | $4,572 | $474,000 | $156,895 | $317,105 |
| 2020 | $4,412 | $430,920 | $143,252 | $287,668 |
| 2019 | $4,057 | $430,920 | $143,252 | $287,668 |
| 2018 | $4,466 | $410,400 | $0 | $0 |
| 2017 | $4,037 | $375,100 | $0 | $0 |
| 2016 | $3,739 | $353,900 | $0 | $0 |
| 2015 | $3,954 | $313,200 | $0 | $0 |
| 2014 | -- | $313,200 | $0 | $0 |
| 2013 | -- | $285,000 | $0 | $0 |
Source: Public Records
Map
Nearby Homes
- 3917 NE 35th Cir
- 0 NE 38th St Unit 14 351274999
- 0 NE 38th St Unit 20 110815407
- 0 NE 38th St Unit 19 708684594
- 0 NE 38th St Unit 21 331125690
- 0 NE 38th St Unit 15 380111173
- 3317 Falk Rd
- 3605 NE 38th St
- 3306 NE 43rd Place
- 5505 NE 43rd Place
- 4456 NE Nicholson Loop
- 0 Falk Rd
- 2727 Rossiter Ln
- 4311 Plomondon St
- 13 Algona Dr
- 4508 NE 41st St
- 3836 NE 45th St Unit A
- 3836 NE 45th St Unit A
- 4505 NE 44th St
- 3000 Grand Blvd
- 3801 Nicholson Rd Unit 3805
- 3801 Nicholson Rd Unit 3803
- 3905 Nicholson Rd
- 3727 Nicholson Rd
- 3712 Nicholson Rd
- 3708 Nicholson Rd
- 3716 Nicholson Rd
- 3703 Nicholson Rd
- 3800 Nicholson Rd Unit 3805
- 3800 Nicholson Rd Unit 3803
- 3800 Nicholson Rd
- 3704 Nicholson Rd
- 3808 Nicholson Rd
- 3700 Nicholson Rd
- 3812 Nicholson Rd
- 3816 Nicholson Rd
- 3900 Nicholson Rd
- 3906 Nicholson Rd
- 3912 Nicholson Rd
- 3930 Nicholson Rd