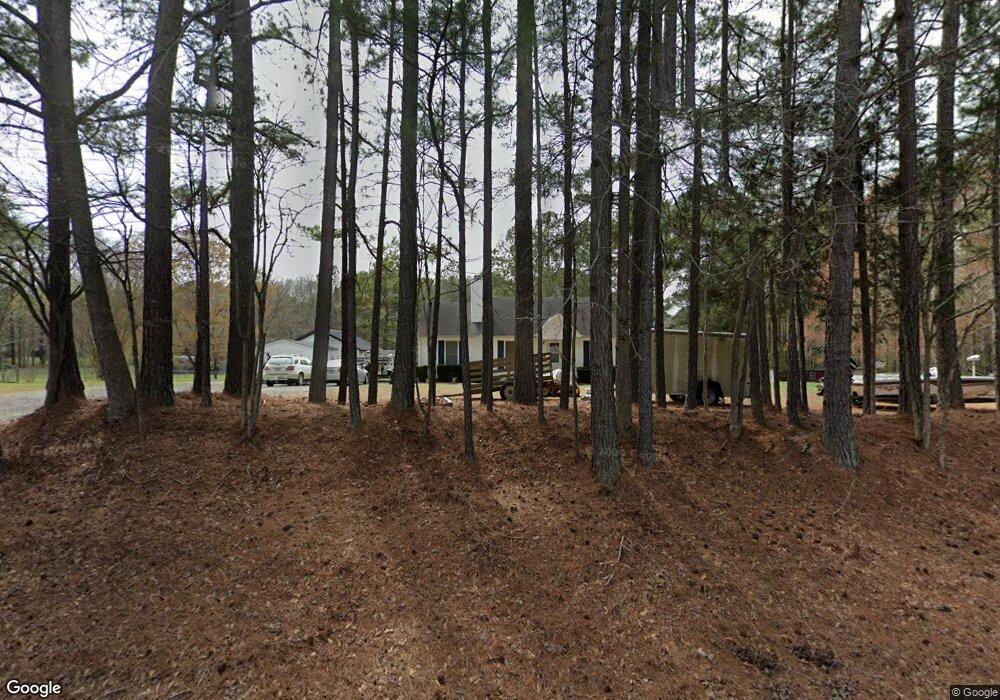
3801 Old Graham Rd Pittsboro, NC 27312
Estimated Value: $392,133 - $484,000
3
Beds
2
Baths
1,317
Sq Ft
$328/Sq Ft
Est. Value
About This Home
This home is located at 3801 Old Graham Rd, Pittsboro, NC 27312 and is currently estimated at $432,033, approximately $328 per square foot. 3801 Old Graham Rd is a home located in Chatham County with nearby schools including Pittsboro Elementary School, George Moses Horton Middle School, and Northwood High.
Ownership History
Date
Name
Owned For
Owner Type
Purchase Details
Closed on
Jun 12, 2025
Sold by
Flanagan Jeffrey J and Flanagan Diane B
Bought by
Flanagan Diane B
Current Estimated Value
Purchase Details
Closed on
Sep 28, 2021
Sold by
Mendenhall Jason G and Mendenhall Valerie
Bought by
Flanagan Jeffrey J and Flanagan Diane B
Purchase Details
Closed on
Jan 26, 2018
Sold by
Copeland Hulon Lance
Bought by
Copeland Hulon Dwayne
Purchase Details
Closed on
May 21, 2010
Sold by
Copeland Pamela L
Bought by
Copeland Hulon Lance
Purchase Details
Closed on
Jan 18, 2008
Sold by
Butzen Sarah K and Albers Benjamin D
Bought by
Copeland Hulon Lance
Home Financials for this Owner
Home Financials are based on the most recent Mortgage that was taken out on this home.
Original Mortgage
$32,000
Interest Rate
6.12%
Mortgage Type
Credit Line Revolving
Create a Home Valuation Report for This Property
The Home Valuation Report is an in-depth analysis detailing your home's value as well as a comparison with similar homes in the area
Home Values in the Area
Average Home Value in this Area
Purchase History
| Date | Buyer | Sale Price | Title Company |
|---|---|---|---|
| Flanagan Diane B | -- | None Listed On Document | |
| Flanagan Diane B | -- | None Listed On Document | |
| Flanagan Jeffrey J | $350,000 | Paul S Messick Jr Gunn & Messi | |
| Copeland Hulon Dwayne | -- | None Available | |
| Copeland Hulon Lance | -- | None Available | |
| Copeland Hulon Lance | $160,000 | None Available |
Source: Public Records
Mortgage History
| Date | Status | Borrower | Loan Amount |
|---|---|---|---|
| Previous Owner | Copeland Hulon Lance | $32,000 |
Source: Public Records
Tax History Compared to Growth
Tax History
| Year | Tax Paid | Tax Assessment Tax Assessment Total Assessment is a certain percentage of the fair market value that is determined by local assessors to be the total taxable value of land and additions on the property. | Land | Improvement |
|---|---|---|---|---|
| 2025 | $2,899 | $334,224 | $55,360 | $278,864 |
| 2024 | $2,056 | $237,029 | $50,300 | $186,729 |
| 2023 | $2,193 | $237,029 | $50,300 | $186,729 |
| 2022 | $2,091 | $237,029 | $50,300 | $186,729 |
| 2021 | $2,094 | $237,029 | $50,300 | $186,729 |
| 2020 | $1,620 | $184,349 | $32,643 | $151,706 |
| 2019 | $1,586 | $184,349 | $32,643 | $151,706 |
| 2018 | $1,509 | $184,349 | $32,643 | $151,706 |
| 2017 | $1,509 | $184,349 | $32,643 | $151,706 |
| 2016 | $1,408 | $167,490 | $30,225 | $137,265 |
| 2015 | $1,397 | $167,490 | $30,225 | $137,265 |
| 2014 | $1,387 | $167,490 | $30,225 | $137,265 |
| 2013 | -- | $167,490 | $30,225 | $137,265 |
Source: Public Records
Map
Nearby Homes
- 255 Corbett Dr
- 259 August Trce Dr
- TBD Alston Horton Service Rd
- 236 Gaines Trail
- 127 Preston Trace
- 99 Corbett Dr
- 520 Swim and Croquet
- Shelby Modern Farmhouse Plan at Corbett Landing
- Chatham Forest English Cottage Plan at Corbett Landing
- Hamilton Craftsman Plan at Corbett Landing
- Delaney English Cottage Plan at Corbett Landing
- Brassfield Craftsman Plan at Corbett Landing
- Oakmont American Farmhouse Plan at Corbett Landing
- 111 Gaines Trail
- Bristol English Cottage Plan at Corbett Landing
- 226 John Williams Ln
- 63 Loggers
- 720 the Parks Dr
- 289 Gaines Trail
- CHANLEY Plan at Corbett Landing
- 3781 Old Graham Rd
- 184 Olde Farm Rd
- 189 Olde Farm Rd
- 3721 Old Graham Rd
- 3833 Old Graham Rd
- 3875 Old Graham Rd
- 150 Olde Farm Rd
- 3887 Old Graham Rd
- 3689 Old Graham Rd
- 173 Olde Farm Rd
- 94 Olde Farm Rd
- 133 Olde Farm Rd
- 28 Olde Farm Rd
- 28 Olde Farm Rd Unit 429
- 115 Olde Farm Rd
- 26 Olde Farm Rd
- 28 Annie B Dark Dr
- 91 Olde Farm Rd
- 67 Olde Farm Rd
- 57 Annie B Dark Dr