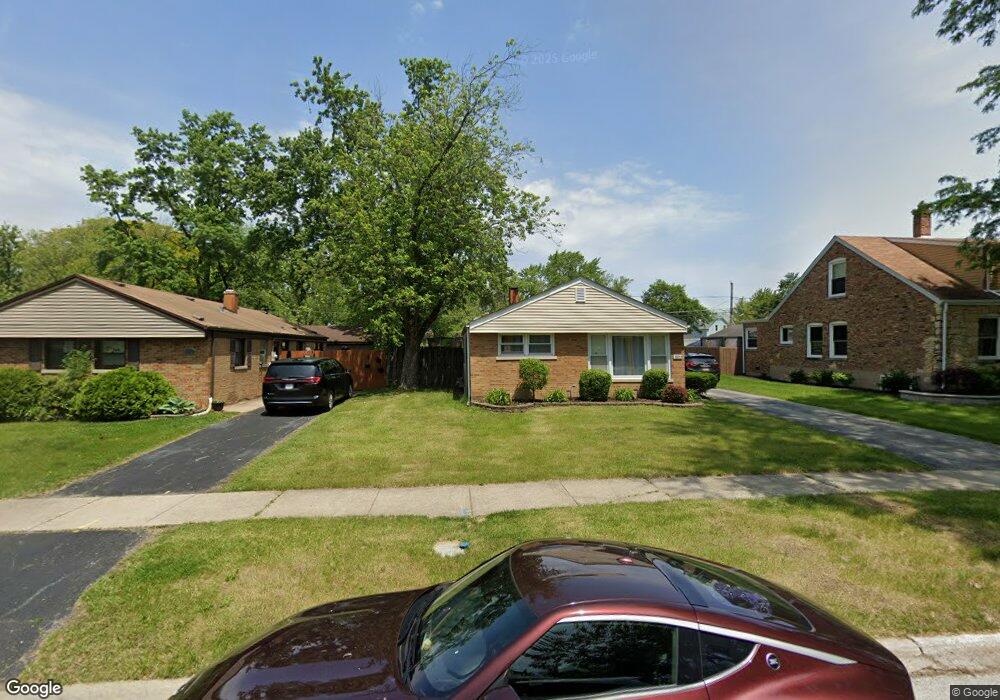
3802 214th St Matteson, IL 60443
Old Matteson NeighborhoodEstimated Value: $170,000 - $201,000
3
Beds
1
Bath
1,210
Sq Ft
$154/Sq Ft
Est. Value
About This Home
This home is located at 3802 214th St, Matteson, IL 60443 and is currently estimated at $186,555, approximately $154 per square foot. 3802 214th St is a home located in Cook County with nearby schools including Illinois School, Matteson Elementary School, and Sauk Elementary School.
Ownership History
Date
Name
Owned For
Owner Type
Purchase Details
Closed on
May 18, 2001
Sold by
Shanley Gretchen L and Sutherland Leroy
Bought by
Mustiful Tonya L
Current Estimated Value
Home Financials for this Owner
Home Financials are based on the most recent Mortgage that was taken out on this home.
Original Mortgage
$91,977
Outstanding Balance
$33,596
Interest Rate
7.23%
Mortgage Type
FHA
Estimated Equity
$152,959
Purchase Details
Closed on
Apr 12, 2000
Sold by
Shanley Kevin W
Bought by
Shanley Gretchen L
Purchase Details
Closed on
Oct 31, 1997
Sold by
Vollman Alice M and Vollman Beverly A
Bought by
Shanley Kevin W and Shanley Gretchen L
Home Financials for this Owner
Home Financials are based on the most recent Mortgage that was taken out on this home.
Original Mortgage
$66,400
Interest Rate
7.37%
Purchase Details
Closed on
Jan 30, 1995
Sold by
Vollman Alice M
Bought by
Vollman Alice M and Vollman Beverly A
Create a Home Valuation Report for This Property
The Home Valuation Report is an in-depth analysis detailing your home's value as well as a comparison with similar homes in the area
Home Values in the Area
Average Home Value in this Area
Purchase History
| Date | Buyer | Sale Price | Title Company |
|---|---|---|---|
| Mustiful Tonya L | $93,000 | -- | |
| Shanley Gretchen L | -- | -- | |
| Shanley Kevin W | $70,000 | Chicago Title Insurance Co | |
| Vollman Alice M | -- | -- |
Source: Public Records
Mortgage History
| Date | Status | Borrower | Loan Amount |
|---|---|---|---|
| Open | Mustiful Tonya L | $91,977 | |
| Previous Owner | Shanley Kevin W | $66,400 |
Source: Public Records
Tax History
| Year | Tax Paid | Tax Assessment Tax Assessment Total Assessment is a certain percentage of the fair market value that is determined by local assessors to be the total taxable value of land and additions on the property. | Land | Improvement |
|---|---|---|---|---|
| 2025 | $4,830 | $13,208 | $3,250 | $9,958 |
| 2024 | $4,830 | $13,208 | $3,250 | $9,958 |
| 2023 | $2,286 | $15,000 | $3,250 | $11,750 |
| 2022 | $2,286 | $7,888 | $2,844 | $5,044 |
| 2021 | $2,367 | $7,634 | $2,843 | $4,791 |
| 2020 | $2,308 | $7,634 | $2,843 | $4,791 |
| 2019 | $3,048 | $9,318 | $2,640 | $6,678 |
| 2018 | $3,044 | $9,318 | $2,640 | $6,678 |
| 2017 | $2,952 | $9,318 | $2,640 | $6,678 |
| 2016 | $2,799 | $8,189 | $2,437 | $5,752 |
| 2015 | $2,713 | $8,189 | $2,437 | $5,752 |
| 2014 | $2,654 | $8,189 | $2,437 | $5,752 |
| 2013 | $2,580 | $8,608 | $2,437 | $6,171 |
Source: Public Records
Map
Nearby Homes
- 21308 Tower Ave
- 3727 214th Place Unit 2
- 3704 215th St Unit 205
- 3615 214th St
- 3919 214th St
- 21406 S Jean Ave
- 3624 216th St
- 21142 Locust St
- 3719 211th Place
- 4022 Richmond Ct
- 3421 Station Dr
- 21616 Richmond Rd
- 21602 Dogwood Rd Unit 1184
- 21617 Dogwood Rd Unit 1125
- 888 Woodstock Rd
- 21635 Dogwood Rd Unit 1165
- 3704 Linden Rd
- 126 Indiana St
- 30 Strauss Ln
- 338 Waldmann Dr
- 3762 214th St
- 3808 214th St
- 3758 214th St
- 3801 213th Place
- 3761 213th Place
- 21331 Tower Ave
- 3754 214th St
- 21417 Butterfield Pkwy
- 3801 214th St
- 3761 214th St
- 3805 214th St
- 3753 213th Place
- 3757 214th St
- 21330 Tower Ave
- 3813 214th St Unit 1
- 21350 Maple St
- 21354 Maple St
- 21415 Butterfield Pkwy
- 3747 213th Place
- 3749 213th Place
Your Personal Tour Guide
Ask me questions while you tour the home.