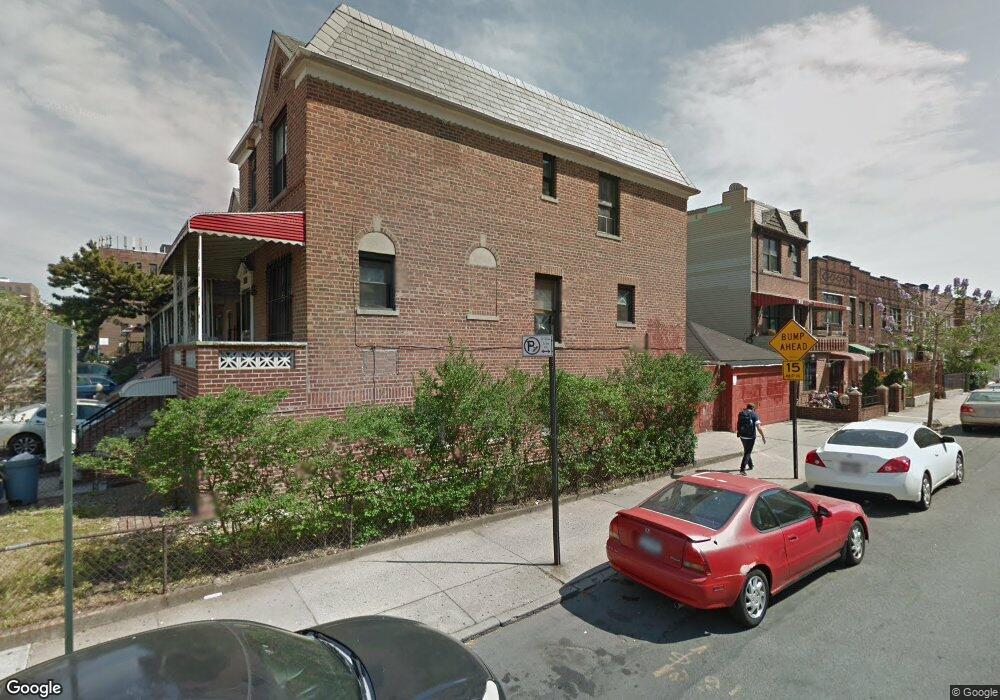
3802 47th Ave Long Island City, NY 11101
Long Island City NeighborhoodEstimated Value: $1,171,931 - $1,508,000
--
Bed
--
Bath
2,356
Sq Ft
$575/Sq Ft
Est. Value
About This Home
This home is located at 3802 47th Ave, Long Island City, NY 11101 and is currently estimated at $1,353,733, approximately $574 per square foot. 3802 47th Ave is a home located in Queens County with nearby schools including P.S. 199 Maurice A Fitzgerald, Long Island City High School, and Most Precious Blood Roman Catholic Church.
Ownership History
Date
Name
Owned For
Owner Type
Purchase Details
Closed on
Jan 15, 2016
Sold by
Badola Neezamadin and Singh Ammarnauth J
Bought by
Ching & Tsan Realty Llc
Current Estimated Value
Home Financials for this Owner
Home Financials are based on the most recent Mortgage that was taken out on this home.
Original Mortgage
$300,000
Outstanding Balance
$238,752
Interest Rate
3.98%
Mortgage Type
New Conventional
Estimated Equity
$1,114,981
Purchase Details
Closed on
Mar 15, 1996
Sold by
Chu Jackson
Bought by
Badola Neezamadin and Singh Ammarnauth J
Home Financials for this Owner
Home Financials are based on the most recent Mortgage that was taken out on this home.
Original Mortgage
$192,000
Interest Rate
7.31%
Purchase Details
Closed on
Jan 8, 1996
Sold by
Chu Yat Min Hong and Hong Yat Min Chu
Bought by
Chu Jackson
Purchase Details
Closed on
May 2, 1995
Sold by
Chu Jackson
Bought by
Chu Yat Min Hong and Hong Yat Min Chu
Create a Home Valuation Report for This Property
The Home Valuation Report is an in-depth analysis detailing your home's value as well as a comparison with similar homes in the area
Home Values in the Area
Average Home Value in this Area
Purchase History
| Date | Buyer | Sale Price | Title Company |
|---|---|---|---|
| Ching & Tsan Realty Llc | $850,000 | -- | |
| Ching & Tsan Realty Llc | $850,000 | -- | |
| Badola Neezamadin | $240,000 | First American Title Ins Co | |
| Badola Neezamadin | $240,000 | First American Title Ins Co | |
| Chu Jackson | -- | -- | |
| Chu Jackson | -- | -- | |
| Chu Yat Min Hong | -- | Chicago Title Insurance Co | |
| Chu Yat Min Hong | -- | Chicago Title Insurance Co |
Source: Public Records
Mortgage History
| Date | Status | Borrower | Loan Amount |
|---|---|---|---|
| Open | Ching & Tsan Realty Llc | $300,000 | |
| Closed | Ching & Tsan Realty Llc | $300,000 | |
| Previous Owner | Badola Neezamadin | $192,000 |
Source: Public Records
Tax History Compared to Growth
Tax History
| Year | Tax Paid | Tax Assessment Tax Assessment Total Assessment is a certain percentage of the fair market value that is determined by local assessors to be the total taxable value of land and additions on the property. | Land | Improvement |
|---|---|---|---|---|
| 2025 | $9,433 | $49,783 | $7,209 | $42,574 |
| 2024 | $9,433 | $46,967 | $7,059 | $39,908 |
| 2023 | $8,899 | $44,309 | $6,207 | $38,102 |
| 2022 | $8,345 | $75,840 | $12,120 | $63,720 |
| 2021 | $8,797 | $76,140 | $12,120 | $64,020 |
| 2020 | $8,781 | $74,340 | $12,120 | $62,220 |
| 2019 | $8,188 | $63,660 | $12,120 | $51,540 |
| 2018 | $7,527 | $36,924 | $9,985 | $26,939 |
| 2017 | $7,101 | $34,836 | $8,407 | $26,429 |
| 2016 | $6,964 | $34,836 | $8,407 | $26,429 |
| 2015 | $3,744 | $34,572 | $10,726 | $23,846 |
| 2014 | $3,744 | $32,616 | $9,741 | $22,875 |
Source: Public Records
Map
Nearby Homes
- 0 39th St
- 4538 40th St
- 48-12 37th St
- 47-25 40th St Unit 2C
- 45-32 41st St
- 48-21 40th St Unit 2C
- 48-21 40th St Unit 5H
- 45-08 40th St Unit F44
- 45-08 40th St Unit F32
- 2594 40th St
- 4827 40th St
- 4720 42nd St Unit 4C
- 41-02 Queens Blvd Unit 4E
- 41-02 Queens Blvd Unit 5-E
- 4805 42nd St Unit 5G
- 43-32 40th St
- 48-01 42nd St Unit 5D
- 3617 Greenpoint Ave
- 43-18 Greenpoint Ave
- 48-23 42nd St Unit 1 J