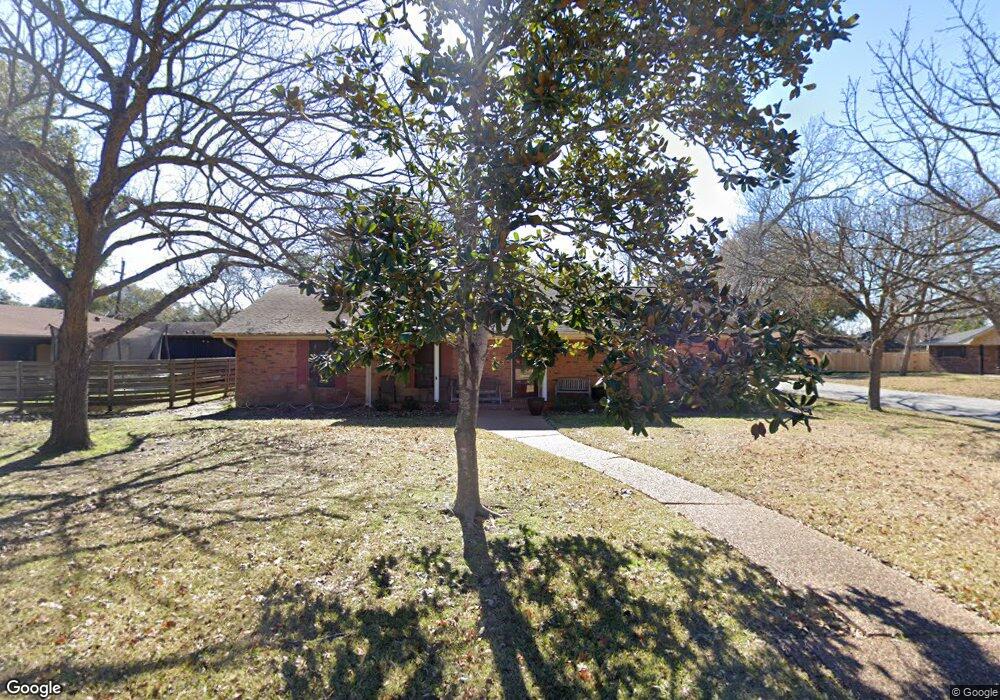
3802 Avenue O Rosenberg, TX 77471
Estimated Value: $228,000 - $292,000
3
Beds
2
Baths
2,111
Sq Ft
$122/Sq Ft
Est. Value
About This Home
This home is located at 3802 Avenue O, Rosenberg, TX 77471 and is currently estimated at $256,780, approximately $121 per square foot. 3802 Avenue O is a home located in Fort Bend County with nearby schools including Taylor Ray Elementary School, Navarro Middle School, and George Junior High School.
Ownership History
Date
Name
Owned For
Owner Type
Purchase Details
Closed on
Jun 2, 2023
Sold by
King Charlotte M
Bought by
Pastor Eva Ilona
Current Estimated Value
Purchase Details
Closed on
Aug 8, 2016
Sold by
Williams Nancy Lee and Clark Nancy L
Bought by
Clark Nancy L
Home Financials for this Owner
Home Financials are based on the most recent Mortgage that was taken out on this home.
Original Mortgage
$235,500
Interest Rate
3.41%
Mortgage Type
Reverse Mortgage Home Equity Conversion Mortgage
Purchase Details
Closed on
Aug 9, 2009
Sold by
Clark Nancy L and Clark Carroll L
Bought by
Clark Nancy L
Purchase Details
Closed on
Nov 6, 2001
Sold by
Clark Nancy L
Bought by
Clark Carroll L
Purchase Details
Closed on
Nov 11, 1997
Sold by
Williams Arthur Lee
Bought by
Williams Nancy Lee
Create a Home Valuation Report for This Property
The Home Valuation Report is an in-depth analysis detailing your home's value as well as a comparison with similar homes in the area
Home Values in the Area
Average Home Value in this Area
Purchase History
| Date | Buyer | Sale Price | Title Company |
|---|---|---|---|
| Pastor Eva Ilona | -- | Select Title | |
| Clark Nancy L | -- | Star Tex Title Co | |
| Clark Nancy L | -- | -- | |
| Clark Carroll L | -- | Chicago Title | |
| Williams Nancy Lee | -- | -- |
Source: Public Records
Mortgage History
| Date | Status | Borrower | Loan Amount |
|---|---|---|---|
| Previous Owner | Clark Nancy L | $235,500 | |
| Closed | Williams Nancy Lee | $0 |
Source: Public Records
Tax History Compared to Growth
Tax History
| Year | Tax Paid | Tax Assessment Tax Assessment Total Assessment is a certain percentage of the fair market value that is determined by local assessors to be the total taxable value of land and additions on the property. | Land | Improvement |
|---|---|---|---|---|
| 2025 | $364 | $195,990 | $31,581 | $194,345 |
| 2024 | $364 | $178,173 | -- | $226,087 |
| 2023 | $317 | $161,975 | $0 | $234,942 |
| 2022 | $1,440 | $147,250 | $0 | $169,750 |
| 2021 | $2,777 | $133,860 | $31,580 | $102,280 |
| 2020 | $2,884 | $135,890 | $31,580 | $104,310 |
| 2019 | $3,053 | $133,670 | $31,580 | $102,090 |
| 2018 | $2,971 | $127,990 | $31,580 | $96,410 |
| 2017 | $2,910 | $124,680 | $31,580 | $93,100 |
| 2016 | $2,913 | $124,790 | $31,580 | $93,210 |
| 2015 | $1,303 | $128,440 | $31,580 | $96,860 |
| 2014 | $1,440 | $126,080 | $31,580 | $94,500 |
Source: Public Records
Map
Nearby Homes
- 1803 Jones St
- 3433 Avenue P
- 1633 Jones St
- 3608 Avenue R
- 1711 Klauke St
- 1926 Klauke Ct
- 1317 Tobola St
- 1300 Lawrence St
- 1215 Lawrence St
- 3604 Rychlik Dr
- 1733 Brumbelow St
- 0 Miles St
- 2123 Moss Bluff Ln
- 1119 Tobola St
- 1009 Lawrence St
- 3219 Creole Bay Ln
- 2126 Ripple Creek Dr
- 1921 Ripple Creek Dr
- 2211 Hackberry Bank Ln
- 2002 Austin St