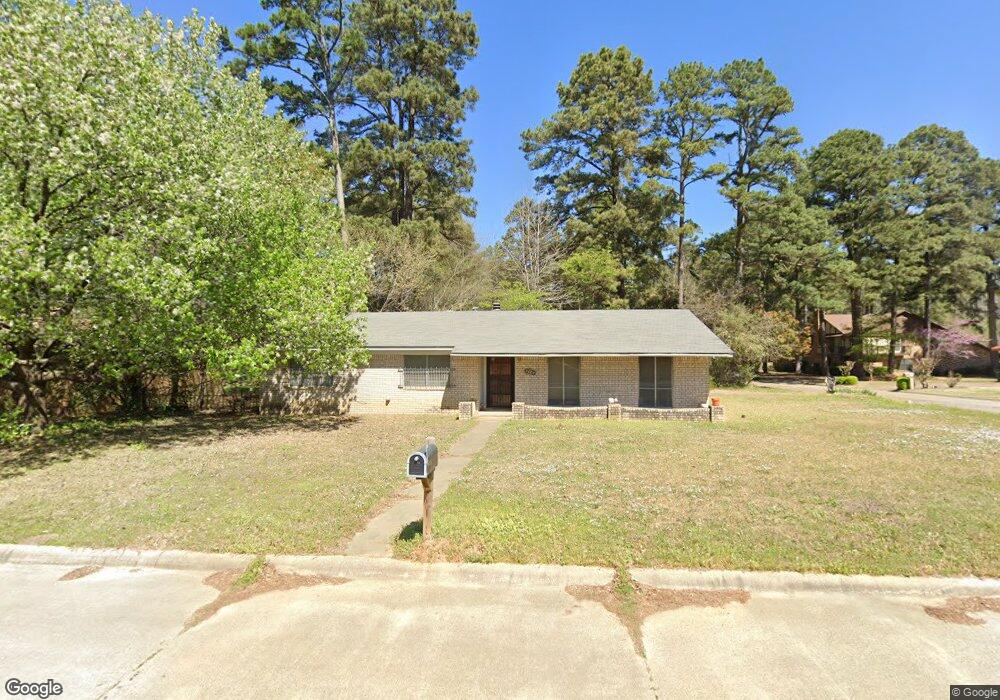
3802 Bamboo St Texarkana, TX 75503
Estimated Value: $167,858 - $205,000
--
Bed
--
Bath
1,520
Sq Ft
$120/Sq Ft
Est. Value
About This Home
This home is located at 3802 Bamboo St, Texarkana, TX 75503 and is currently estimated at $182,965, approximately $120 per square foot. 3802 Bamboo St is a home located in Bowie County with nearby schools including Margaret Fischer Davis Elementary School, Pleasant Grove Intermediate School, and Pleasant Grove Middle School.
Ownership History
Date
Name
Owned For
Owner Type
Purchase Details
Closed on
Jan 13, 2023
Sold by
Smith John D and Smith Catherine P
Bought by
Smith Justin Daniel and Smith Rhonda
Current Estimated Value
Purchase Details
Closed on
Aug 8, 2015
Sold by
Sandage Shannon K
Bought by
Smith John D and Smith Catherine P
Purchase Details
Closed on
Dec 13, 2010
Sold by
Sandage Joshua David
Bought by
Sandage Shannon Kay
Purchase Details
Closed on
Aug 10, 2006
Sold by
Flowers Mary C and Flowers Mary Carolyn
Bought by
Sandage Joshua D
Home Financials for this Owner
Home Financials are based on the most recent Mortgage that was taken out on this home.
Original Mortgage
$87,290
Interest Rate
6.78%
Create a Home Valuation Report for This Property
The Home Valuation Report is an in-depth analysis detailing your home's value as well as a comparison with similar homes in the area
Home Values in the Area
Average Home Value in this Area
Purchase History
| Date | Buyer | Sale Price | Title Company |
|---|---|---|---|
| Smith Justin Daniel | -- | Twin City Title | |
| Smith John D | $90,000 | None Available | |
| Sandage Shannon Kay | -- | None Available | |
| Sandage Joshua D | -- | None Available |
Source: Public Records
Mortgage History
| Date | Status | Borrower | Loan Amount |
|---|---|---|---|
| Previous Owner | Sandage Joshua D | $87,290 |
Source: Public Records
Tax History Compared to Growth
Tax History
| Year | Tax Paid | Tax Assessment Tax Assessment Total Assessment is a certain percentage of the fair market value that is determined by local assessors to be the total taxable value of land and additions on the property. | Land | Improvement |
|---|---|---|---|---|
| 2025 | $2,233 | $153,699 | $22,000 | $131,699 |
| 2024 | $2,233 | $153,798 | $22,000 | $131,798 |
| 2023 | $3,253 | $144,476 | $22,000 | $122,476 |
| 2022 | $3,242 | $132,021 | $22,000 | $110,021 |
| 2021 | $2,836 | $108,430 | $18,000 | $90,430 |
| 2020 | $2,741 | $104,276 | $18,000 | $86,276 |
| 2019 | $2,706 | $100,328 | $18,000 | $82,328 |
| 2018 | $2,610 | $97,298 | $18,000 | $79,298 |
| 2017 | $2,563 | $95,810 | $18,000 | $77,810 |
| 2016 | $2,563 | $95,810 | $18,000 | $77,810 |
| 2015 | $2,536 | $97,236 | $18,000 | $79,236 |
| 2014 | $2,536 | $94,328 | $18,000 | $76,328 |
Source: Public Records
Map
Nearby Homes
- 4011 Columbine Ln
- 101 Sierra Madre Ln
- TBD Hidden Ac Dr Lot 17
- 0 Greenbriar Lot 14
- 204 Arroyo Dr
- hwy 71 N 71 N
- N/A Richmond Meadows
- 3620 Moores Ln
- 1519 Moores Ln
- 3506 Moores Ln
- 0 Cowhorn Creek Loop
- hawkins Hawkins
- TBD U S 59
- 5917 Sidney Dr
- 3103 Crestridge Dr
- 3 Spring Cove
- 3108 Crestridge Dr
- 5808 Cooks Ln
- 5810 Cooks Ln
- 5812 Cooks Ln