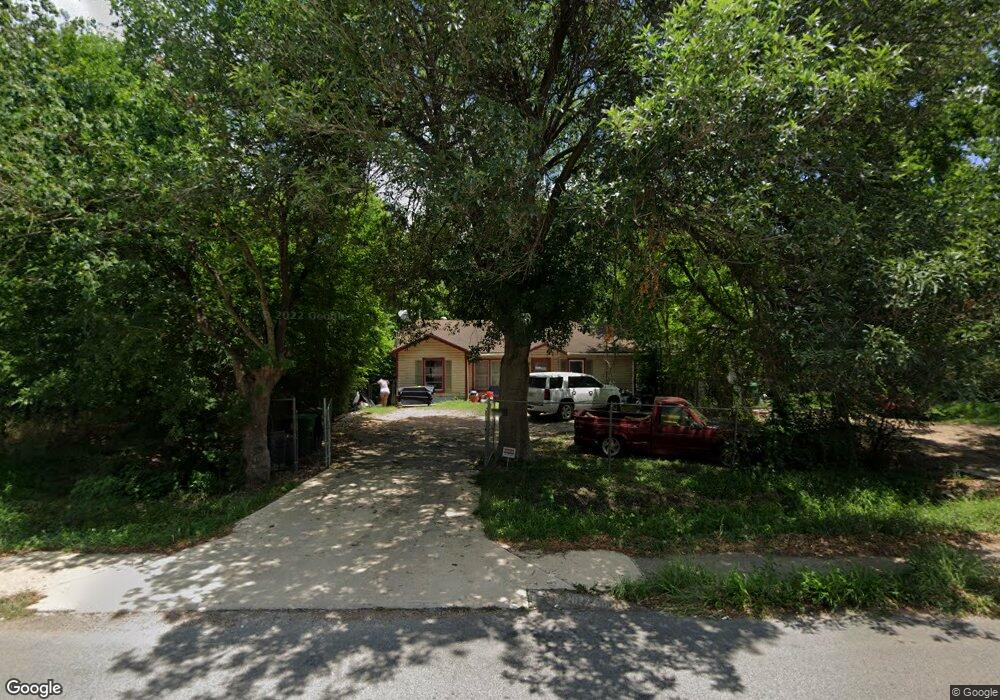
3803 Corder St Houston, TX 77021
OST-South Union NeighborhoodEstimated Value: $153,010 - $190,000
3
Beds
1
Bath
1,144
Sq Ft
$150/Sq Ft
Est. Value
About This Home
This home is located at 3803 Corder St, Houston, TX 77021 and is currently estimated at $172,003, approximately $150 per square foot. 3803 Corder St is a home located in Harris County with nearby schools including Whidby Elementary School, Cullen Middle School, and Yates High School.
Ownership History
Date
Name
Owned For
Owner Type
Purchase Details
Closed on
Mar 29, 2018
Sold by
Greatlife Llc
Bought by
Camarillo Edgar Daniel
Current Estimated Value
Home Financials for this Owner
Home Financials are based on the most recent Mortgage that was taken out on this home.
Original Mortgage
$88,500
Outstanding Balance
$76,002
Interest Rate
4.38%
Mortgage Type
Seller Take Back
Estimated Equity
$96,001
Purchase Details
Closed on
Aug 8, 2011
Sold by
Beneficial Texas Inc
Bought by
Greatlife Llc Series 4
Purchase Details
Closed on
Feb 1, 2011
Sold by
Burden Joseph and Burden Rose
Bought by
Beneficial Financial 1 Inc
Purchase Details
Closed on
Sep 30, 1994
Sold by
Lawal Omotayo J
Bought by
Burden Joseph and Burden Rose
Home Financials for this Owner
Home Financials are based on the most recent Mortgage that was taken out on this home.
Original Mortgage
$24,500
Interest Rate
8.5%
Mortgage Type
Seller Take Back
Create a Home Valuation Report for This Property
The Home Valuation Report is an in-depth analysis detailing your home's value as well as a comparison with similar homes in the area
Home Values in the Area
Average Home Value in this Area
Purchase History
| Date | Buyer | Sale Price | Title Company |
|---|---|---|---|
| Camarillo Edgar Daniel | -- | South Land Title Llc | |
| Greatlife Llc Series 4 | -- | Lsi Title Agency Inc | |
| Beneficial Financial 1 Inc | $48,503 | None Available | |
| Burden Joseph | -- | -- |
Source: Public Records
Mortgage History
| Date | Status | Borrower | Loan Amount |
|---|---|---|---|
| Open | Camarillo Edgar Daniel | $88,500 | |
| Previous Owner | Burden Joseph | $24,500 |
Source: Public Records
Tax History Compared to Growth
Tax History
| Year | Tax Paid | Tax Assessment Tax Assessment Total Assessment is a certain percentage of the fair market value that is determined by local assessors to be the total taxable value of land and additions on the property. | Land | Improvement |
|---|---|---|---|---|
| 2025 | $2,950 | $142,757 | $112,344 | $30,413 |
| 2024 | $2,950 | $140,997 | $102,982 | $38,015 |
| 2023 | $2,950 | $152,889 | $98,301 | $54,588 |
| 2022 | $3,158 | $143,444 | $84,258 | $59,186 |
| 2021 | $2,344 | $100,592 | $51,491 | $49,101 |
| 2020 | $1,926 | $79,524 | $31,597 | $47,927 |
| 2019 | $1,660 | $65,612 | $24,575 | $41,037 |
| 2018 | $1,555 | $61,440 | $21,065 | $40,375 |
| 2017 | $1,554 | $61,440 | $21,065 | $40,375 |
| 2016 | $1,282 | $50,696 | $14,063 | $36,633 |
| 2015 | $1,303 | $50,696 | $14,063 | $36,633 |
| 2014 | $1,303 | $50,696 | $14,063 | $36,633 |
Source: Public Records
Map
Nearby Homes
- 3824 Amos St
- 3617 Dreyfus St
- 3827 Amos St
- 7209 La Salette St
- 3734 Corder St
- 3810 Lehall St
- 3830 Mount Pleasant St
- 3804 Mount Pleasant St Unit 9
- 3730 Lehall St
- 3722 Nathaniel Brown St
- 3706 Nathaniel Brown St
- 3814 Seabrook St
- 3624 Corder St
- 3848 Seabrook St
- 3634 Dreyfus St
- 3811 Noah St
- 3839 Noah St Unit A/B
- 3638 Nathaniel Brown St
- 3655 Seabrook St
- 3733 Noah St
- 3807 Corder St
- 3802 Dreyfus St
- 3747 Corder St
- 3806 Dreyfus St
- 3811 Corder St
- 3746 Dreyfus St
- 3810 Dreyfus St
- 3743 Corder St
- 3815 Corder St
- 3742 Dreyfus St
- 3814 Dreyfus St
- 3739 Corder St
- 3810 Corder St
- 3746 Corder St
- 3819 Corder St
- 3738 Dreyfus St
- 3818 Dreyfus St
- 3803 Dreyfus St
- 3807 Dreyfus St
- 3747 Dreyfus St