
Landlord's Agent in 2022
Ulla Scheik
Elevate Realty Solutions, LLC
(571) 373-6183
13 Total Sales


Estimated Value: $350,398 - $372,000
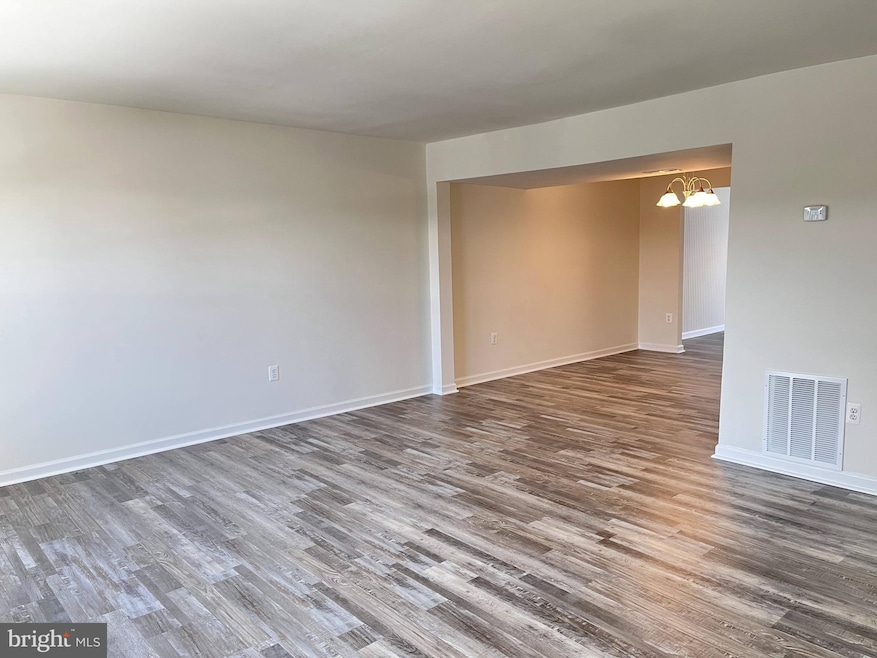
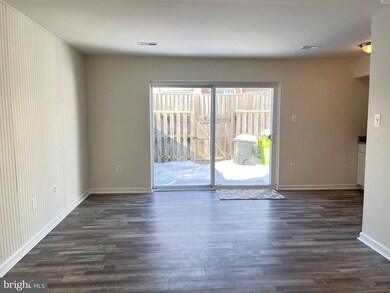
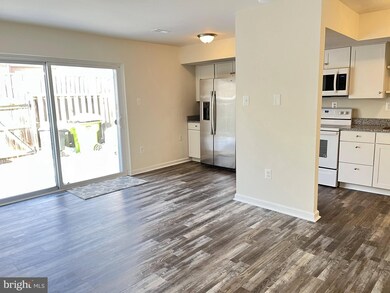
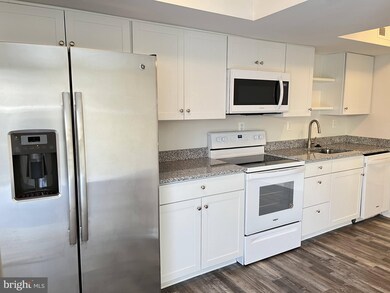
Recently updated townhome ready for move-in! Hardwood floors on main level, carpet upstairs. Newer appliances and washer and dryer. Schedule a tour today!
**Pets accepted on a case by case basis, minimum credit score of 620**
Last Agent to Rent the Property
(571) 373-6183 ulla@richeypm.com Elevate Realty Solutions, LLC Listed on: 01/10/2022
Last Renter's Agent
(540) 428-6726 regiswellsrealtor@gmail.com M.O. Wilson Properties License #0225211032
| Date | Buyer | Sale Price | Title Company |
|---|---|---|---|
| Alamgir Mezbah | $285,000 | Db Title Llc |
| Date | Status | Borrower | Loan Amount |
|---|---|---|---|
| Open | Alamgir Mezbah | $228,000 |
| Date | Event | Price | List to Sale | Price per Sq Ft | Prior Sale |
|---|---|---|---|---|---|
| 02/11/2022 02/11/22 | Rented | $1,895 | 0.0% | -- | |
| 01/10/2022 01/10/22 | For Rent | $1,895 | 0.0% | -- | |
| 12/22/2021 12/22/21 | Sold | $285,000 | +1.8% | $180 / Sq Ft | View Prior Sale |
| 11/25/2021 11/25/21 | Pending | -- | -- | -- | |
| 11/16/2021 11/16/21 | For Sale | $279,900 | -- | $177 / Sq Ft |
| Year | Tax Paid | Tax Assessment Tax Assessment Total Assessment is a certain percentage of the fair market value that is determined by local assessors to be the total taxable value of land and additions on the property. | Land | Improvement |
|---|---|---|---|---|
| 2025 | $2,843 | $305,300 | $122,000 | $183,300 |
| 2024 | $2,843 | $285,900 | $114,000 | $171,900 |
| 2023 | $2,743 | $263,600 | $104,600 | $159,000 |
| 2022 | $2,726 | $246,100 | $96,900 | $149,200 |
| 2021 | $2,371 | $198,000 | $80,100 | $117,900 |
| 2020 | $2,756 | $177,800 | $72,100 | $105,700 |
| 2019 | $2,674 | $172,500 | $70,000 | $102,500 |
| 2018 | $2,033 | $168,400 | $67,300 | $101,100 |
| 2017 | $1,951 | $161,700 | $64,100 | $97,600 |
| 2016 | $1,887 | $157,900 | $62,300 | $95,600 |
| 2015 | $1,490 | $139,200 | $54,600 | $84,600 |
| 2014 | $1,490 | $122,000 | $44,900 | $77,100 |
Landlord's Agent in 2022
Ulla Scheik
Elevate Realty Solutions, LLC
(571) 373-6183
13 Total Sales
Tenant's Agent in 2022
Regis Wells
M.O. Wilson Properties
(540) 428-6726
2 in this area
21 Total Sales
Seller's Agent in 2021
Robert Terry
Real Broker, LLC
(703) 408-7802
1 in this area
7 Total Sales
Buyer's Agent in 2021
Rukshan Haththotuwa
Samson Properties
(202) 459-3417
1 in this area
11 Total Sales
Source: Bright MLS
MLS Number: VAPW2016284
APN: 8188-89-8309
Disclaimer: Certain information contained herein is derived from information provided by parties other than Homes.com. All information provided is deemed reliable, but is not guaranteed to be accurate and should be independently verified.
![]() The data relating to real estate for sale on this website appears in part through the BRIGHT Internet Data Exchange program, a voluntary cooperative exchange of property listing data between licensed real estate brokerage firms, and is provided by BRIGHT through a licensing agreement.
The data relating to real estate for sale on this website appears in part through the BRIGHT Internet Data Exchange program, a voluntary cooperative exchange of property listing data between licensed real estate brokerage firms, and is provided by BRIGHT through a licensing agreement.
Listing information is from various brokers who participate in the Bright MLS IDX program and not all listings may be visible on the site.
The property information being provided on or through the website is for the personal, non-commercial use of consumers and such information may not be used for any purpose other than to identify prospective properties consumers may be interested in purchasing.
Some properties which appear for sale on the website may no longer be available because they are for instance, under contract, sold or are no longer being offered for sale.
Property information displayed is deemed reliable but is not guaranteed.
Copyright 2025 Bright MLS, Inc.