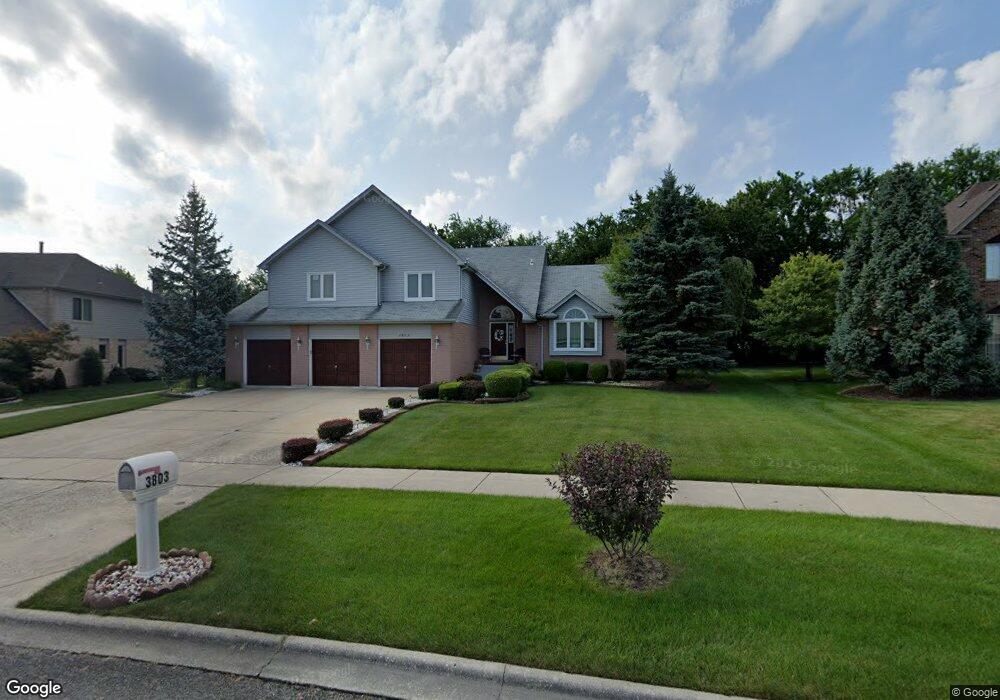
3803 River Rd Hazel Crest, IL 60429
Village West NeighborhoodEstimated Value: $437,000 - $505,000
4
Beds
3
Baths
3,040
Sq Ft
$153/Sq Ft
Est. Value
About This Home
This home is located at 3803 River Rd, Hazel Crest, IL 60429 and is currently estimated at $465,817, approximately $153 per square foot. 3803 River Rd is a home located in Cook County with nearby schools including Flossmoor Hills Elementary School, Parker Junior High School, and Homewood-Flossmoor High School.
Ownership History
Date
Name
Owned For
Owner Type
Purchase Details
Closed on
Aug 31, 2017
Sold by
Taylor George Henry Lee and Taylor George Jiles
Bought by
George Henry Lee and Taylor George Jiles Joyce
Current Estimated Value
Purchase Details
Closed on
Apr 14, 2000
Sold by
Rhodes James L and Rhodes Cynthia E Lyle
Bought by
George Henry Lee and Taylor George Jiles
Home Financials for this Owner
Home Financials are based on the most recent Mortgage that was taken out on this home.
Original Mortgage
$223,200
Interest Rate
8.56%
Purchase Details
Closed on
May 1, 1995
Sold by
Grand National Bank
Bought by
Rhodes James L and Lyle Rhodes Cynthia E
Home Financials for this Owner
Home Financials are based on the most recent Mortgage that was taken out on this home.
Original Mortgage
$202,000
Interest Rate
7.9%
Create a Home Valuation Report for This Property
The Home Valuation Report is an in-depth analysis detailing your home's value as well as a comparison with similar homes in the area
Home Values in the Area
Average Home Value in this Area
Purchase History
We collect this data history from publicly available records. To have your information removed, we recommend requesting removal directly through your county’s website.
| Date | Buyer | Sale Price | Title Company |
|---|---|---|---|
| George Henry Lee | -- | Attorney | |
| George Henry Lee | $280,000 | -- | |
| Rhodes James L | $242,000 | -- |
Source: Public Records
Mortgage History
We collect this data history from publicly available records. To have your information removed, we recommend requesting removal directly through your county’s website.
| Date | Status | Borrower | Loan Amount |
|---|---|---|---|
| Previous Owner | George Henry Lee | $223,200 | |
| Previous Owner | Rhodes James L | $202,000 |
Source: Public Records
Tax History
| Year | Tax Paid | Tax Assessment Tax Assessment Total Assessment is a certain percentage of the fair market value that is determined by local assessors to be the total taxable value of land and additions on the property. | Land | Improvement |
|---|---|---|---|---|
| 2025 | $17,425 | $39,000 | $10,901 | $28,099 |
| 2024 | $17,425 | $39,000 | $10,901 | $28,099 |
| 2023 | $13,222 | $39,000 | $10,901 | $28,099 |
| 2022 | $13,222 | $24,383 | $9,593 | $14,790 |
| 2021 | $10,022 | $24,383 | $9,593 | $14,790 |
| 2020 | $10,022 | $24,383 | $9,593 | $14,790 |
| 2019 | $0 | $21,854 | $8,721 | $13,133 |
| 2018 | $0 | $21,854 | $8,721 | $13,133 |
| 2017 | $10,022 | $23,556 | $8,721 | $14,835 |
| 2016 | $7,921 | $18,944 | $7,848 | $11,096 |
| 2015 | $7,620 | $18,944 | $7,848 | $11,096 |
| 2014 | $11,301 | $23,674 | $7,848 | $15,826 |
| 2013 | $10,458 | $24,386 | $7,848 | $16,538 |
Source: Public Records
Map
Nearby Homes
- 3800 River Rd
- 3811 River Rd Unit II
- 3710 Briar Ln
- 3902 Edgewater Dr
- 3712 Beech St
- 3641 Beech St
- 800 Elm St
- 3604 Robert Ct
- 718 Central Park Ave
- 4029 187th Place
- 754 Central Park Ave
- 4445 Provincetown Dr
- 4047 187th Place
- 4521 Provincetown Dr
- 121 Williamsburg Rd Unit 1
- 18900 Oakwood Ct
- 4542 Windsor Ln
- 2302 Windsor Ln
- 18630 Golfview Dr
- 18650 Golfview Dr
- 3803 River Rd
- 3805 River Rd
- 3801 River Rd
- 3807 River Rd
- 3715 River Rd
- 3802 River Rd
- 3804 River Rd
- 3809 River Rd
- 18709 Springfield Ave
- 3717 Briar Ln
- 3715 Briar Ln
- 3714 River Rd
- 3713 River Rd
- 3813 Streamwood Dr
- 3714 Briar Ln
- 3815 Streamwood Dr
- 3811 Streamwood Dr
- 3712 Briar Ln
- 3712 River Rd
- 3813 River Rd
Your Personal Tour Guide
Ask me questions while you tour the home.