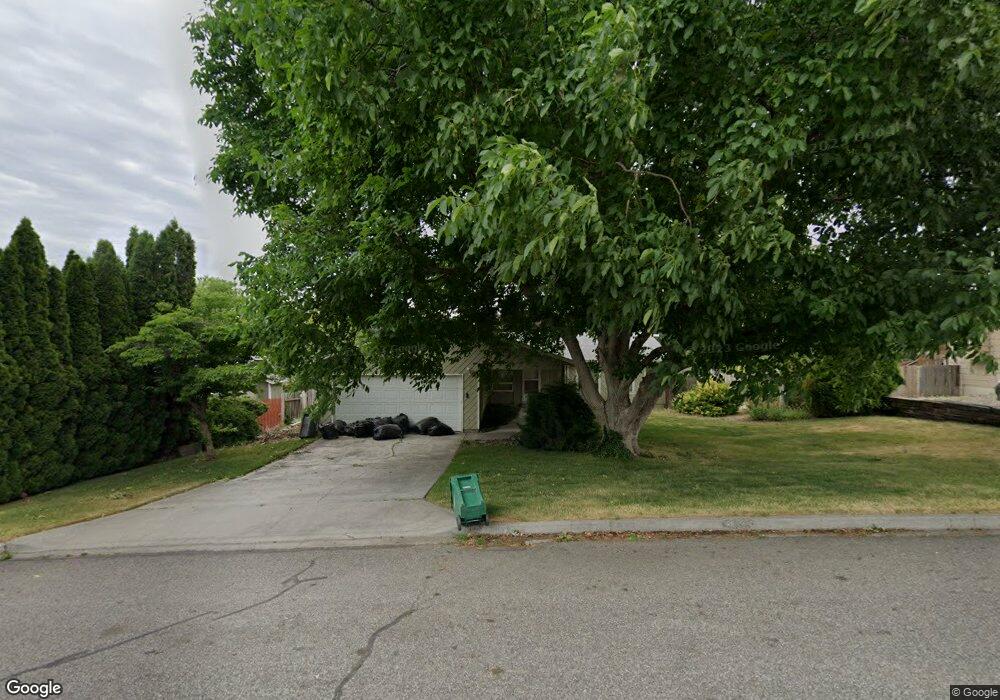
3803 S Buntin Loop Kennewick, WA 99337
Estimated Value: $318,000 - $418,000
3
Beds
2
Baths
1,607
Sq Ft
$239/Sq Ft
Est. Value
About This Home
This home is located at 3803 S Buntin Loop, Kennewick, WA 99337 and is currently estimated at $384,400, approximately $239 per square foot. 3803 S Buntin Loop is a home located in Benton County with nearby schools including Sagecrest Elementary School, Horse Heaven Hills Middle School, and Southridge High School.
Ownership History
Date
Name
Owned For
Owner Type
Purchase Details
Closed on
Jul 25, 2025
Sold by
Keller Brock James
Bought by
Keller Brock James and Haberkorn Keanna
Current Estimated Value
Home Financials for this Owner
Home Financials are based on the most recent Mortgage that was taken out on this home.
Original Mortgage
$340,000
Outstanding Balance
$339,420
Interest Rate
6.81%
Mortgage Type
New Conventional
Estimated Equity
$44,980
Purchase Details
Closed on
Oct 21, 2024
Sold by
Lint Mary F
Bought by
Keller Brock James
Purchase Details
Closed on
Dec 28, 2009
Sold by
Wood Jack P and Wood Nichole L
Bought by
Lint Mary F
Home Financials for this Owner
Home Financials are based on the most recent Mortgage that was taken out on this home.
Original Mortgage
$100,000
Interest Rate
4.78%
Mortgage Type
New Conventional
Create a Home Valuation Report for This Property
The Home Valuation Report is an in-depth analysis detailing your home's value as well as a comparison with similar homes in the area
Home Values in the Area
Average Home Value in this Area
Purchase History
| Date | Buyer | Sale Price | Title Company |
|---|---|---|---|
| Keller Brock James | $313 | Ticor Title | |
| Keller Brock James | $311,500 | Ticor Title | |
| Lint Mary F | $155,000 | Frontier Title & Escrow Co |
Source: Public Records
Mortgage History
| Date | Status | Borrower | Loan Amount |
|---|---|---|---|
| Open | Keller Brock James | $340,000 | |
| Previous Owner | Lint Mary F | $100,000 |
Source: Public Records
Tax History Compared to Growth
Tax History
| Year | Tax Paid | Tax Assessment Tax Assessment Total Assessment is a certain percentage of the fair market value that is determined by local assessors to be the total taxable value of land and additions on the property. | Land | Improvement |
|---|---|---|---|---|
| 2024 | $2,621 | $344,830 | $70,000 | $274,830 |
| 2023 | $2,621 | $326,510 | $70,000 | $256,510 |
| 2022 | $2,254 | $271,540 | $70,000 | $201,540 |
| 2021 | $2,149 | $229,460 | $50,000 | $179,460 |
| 2020 | $2,123 | $212,090 | $50,000 | $162,090 |
| 2019 | $1,957 | $200,510 | $50,000 | $150,510 |
| 2018 | $2,025 | $188,940 | $50,000 | $138,940 |
| 2017 | $1,698 | $159,990 | $50,000 | $109,990 |
| 2016 | $2,164 | $146,660 | $34,000 | $112,660 |
| 2015 | $2,166 | $146,660 | $34,000 | $112,660 |
| 2014 | -- | $146,660 | $34,000 | $112,660 |
| 2013 | -- | $146,660 | $34,000 | $112,660 |
Source: Public Records
Map
Nearby Homes
- 3707 S Buntin Ct
- 4007 S Waverly St
- 4221 S Yelm Place
- 3467 S Dennis St
- 2107 W 34th Ave
- 3435 S Dennis St
- 3304 S Vancouver Place
- 4302 S Conway Place
- 2629 W 44th Place
- 4009 S Fisher St
- 3614 S Green St
- 2527 W 33rd Place
- 3516 S Fisher Ct
- 2302 W 31st Ave
- 1052 S Underwood Place
- 1030 S Underwood Place
- 1119 S Underwood Place
- 1097 S Underwood Place
- 1008 S Underwood Place
- 1031 S Underwood Place
- 3801 S Buntin Loop Unit Beautiful Kennewick
- 3801 S Buntin Loop Unit LARGE lot in superb
- 3801 S Buntin Loop
- 3805 S Buntin Loop
- 3814 S Anderson St
- 3812 S Anderson St
- 3904 S Anderson St
- 3705 S Buntin Loop
- 3802 S Buntin Loop
- 3807 S Buntin Loop
- 3810 S Anderson St
- 3704 S Buntin Loop
- 3804 S Buntin Loop
- 3906 S Anderson St Unit BRAND NEW ROOF!
- 3906 S Anderson St Unit Beautiful Home! Amaz
- 3906 S Anderson St
- 2307 W 37th Ave
- 3809 S Buntin Loop
- 2305 W 37th Ave
- 3808 S Anderson St