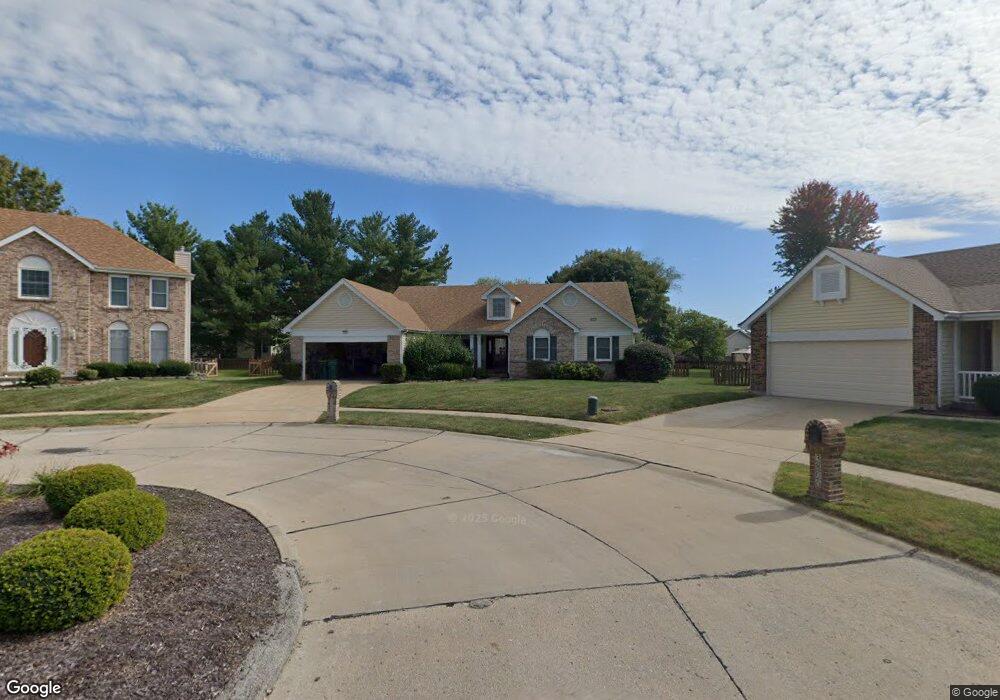
3804 Hartack Ct Florissant, MO 63034
Estimated Value: $307,000 - $340,000
3
Beds
3
Baths
2,031
Sq Ft
$159/Sq Ft
Est. Value
About This Home
This home is located at 3804 Hartack Ct, Florissant, MO 63034 and is currently estimated at $323,684, approximately $159 per square foot. 3804 Hartack Ct is a home located in St. Louis County with nearby schools including Barrington Elementary School, North Middle School, and Hazelwood Central High School.
Ownership History
Date
Name
Owned For
Owner Type
Purchase Details
Closed on
Jan 30, 2012
Sold by
Drake Melvin and Living Shirley Mae Drake
Bought by
Drake Melvin and Drake Shirley Mae
Current Estimated Value
Purchase Details
Closed on
Dec 17, 2010
Sold by
Drake Melvin and Drake Shirley Mae
Bought by
Drake Melvin and Living Shirley Mae Drake
Purchase Details
Closed on
Jan 3, 2008
Sold by
The Robert J Wiesmann & Judith A Wiesman
Bought by
Drake Melvin and Drake Shirley M
Home Financials for this Owner
Home Financials are based on the most recent Mortgage that was taken out on this home.
Original Mortgage
$154,000
Outstanding Balance
$96,751
Interest Rate
6.07%
Mortgage Type
Purchase Money Mortgage
Estimated Equity
$226,933
Purchase Details
Closed on
Feb 15, 1999
Sold by
Wiesmann Robert J and Wiesmann Judith A
Bought by
Wiesmann Robert J and Wiesmann Judith A
Create a Home Valuation Report for This Property
The Home Valuation Report is an in-depth analysis detailing your home's value as well as a comparison with similar homes in the area
Home Values in the Area
Average Home Value in this Area
Purchase History
| Date | Buyer | Sale Price | Title Company |
|---|---|---|---|
| Drake Melvin | -- | None Available | |
| Drake Melvin | -- | None Available | |
| Drake Melvin | $209,000 | None Available | |
| Wiesmann Robert J | -- | -- |
Source: Public Records
Mortgage History
| Date | Status | Borrower | Loan Amount |
|---|---|---|---|
| Open | Drake Melvin | $154,000 |
Source: Public Records
Tax History Compared to Growth
Tax History
| Year | Tax Paid | Tax Assessment Tax Assessment Total Assessment is a certain percentage of the fair market value that is determined by local assessors to be the total taxable value of land and additions on the property. | Land | Improvement |
|---|---|---|---|---|
| 2025 | $4,686 | $54,310 | $7,850 | $46,460 |
| 2024 | $4,686 | $52,040 | $4,520 | $47,520 |
| 2023 | $4,670 | $52,040 | $4,520 | $47,520 |
| 2022 | $4,067 | $40,300 | $6,760 | $33,540 |
| 2021 | $3,847 | $40,300 | $6,760 | $33,540 |
| 2020 | $3,536 | $34,490 | $6,750 | $27,740 |
| 2019 | $3,508 | $34,490 | $6,750 | $27,740 |
| 2018 | $3,402 | $30,920 | $4,470 | $26,450 |
| 2017 | $3,398 | $30,920 | $4,470 | $26,450 |
| 2016 | $3,122 | $27,920 | $4,470 | $23,450 |
| 2015 | $3,003 | $27,920 | $4,470 | $23,450 |
| 2014 | $3,324 | $30,800 | $6,190 | $24,610 |
Source: Public Records
Map
Nearby Homes
- 15645 Chaste St
- 623 Bugle Run Dr
- 15509 Debridge Way
- 4242 Vaile Ave
- 15520 97th Ave
- 15561 Debridge Way
- 4120 90th Ave
- 3914 Birkemeier Dr
- 1056 Saratoga Springs Ct
- 16256 Rose Wreath Ln Unit 156
- 3830 Arbre Ln
- 3716 Rue de Renard
- 15412 Forte de France Ln
- 15467 Jost Main St
- 985 Brookfield Chase Ct
- 3879 Hirondelle Ln
- 3898 Hirondelle Ln
- 1323 Woodpath Dr
- 2756 Aberdeen Dr
- 3213 Yvette Ct
- 3800 Hartack Ct
- 800 Sprinters Row Dr
- 3808 Hartack Ct
- 804 Sprinters Row Dr
- 4236 Chaste St
- 4230 Chaste St
- 4242 Chaste St
- 4224 Chaste St
- 826 Sprinters Row Dr
- 3812 Hartack Ct
- 3801 Hartack Ct
- 801 Sprinters Row Dr
- 4248 Chaste St
- 818 Sprinters Row Dr
- 3805 Hartack Ct
- 4218 Chaste St
- 840 Sprinters Row Dr
- 4254 Chaste St
- 805 Sprinters Row Dr
- 4212 Chaste St