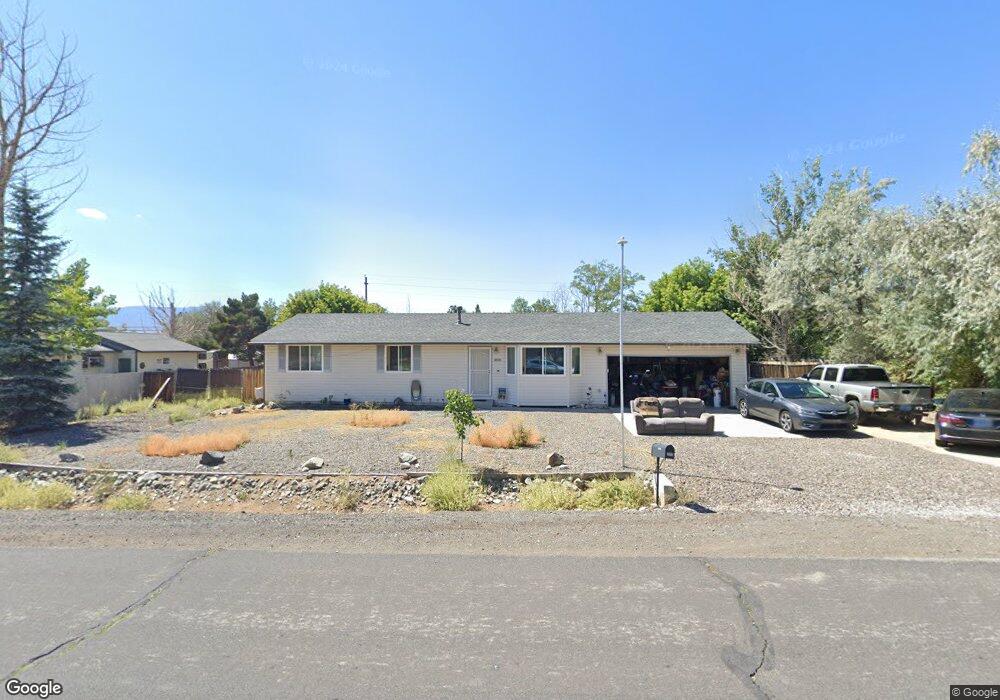
3805 Brant St Reno, NV 89508
Cold Springs NeighborhoodEstimated Value: $384,000 - $392,000
3
Beds
2
Baths
1,120
Sq Ft
$346/Sq Ft
Est. Value
About This Home
This home is located at 3805 Brant St, Reno, NV 89508 and is currently estimated at $387,749, approximately $346 per square foot. 3805 Brant St is a home located in Washoe County with nearby schools including Nancy Gomes Elementary School, Cold Springs Middle Schools, and North Valleys High School.
Ownership History
Date
Name
Owned For
Owner Type
Purchase Details
Closed on
Jan 22, 2018
Sold by
Wofford Scott B
Bought by
Scott Kevin Christopher and Scott Shannon Elizabeth
Current Estimated Value
Home Financials for this Owner
Home Financials are based on the most recent Mortgage that was taken out on this home.
Original Mortgage
$4,747
Interest Rate
4.38%
Mortgage Type
Unknown
Purchase Details
Closed on
Nov 3, 2014
Sold by
Wofford Scott B and Wofford Andrea J
Bought by
Wofford Scott B
Home Financials for this Owner
Home Financials are based on the most recent Mortgage that was taken out on this home.
Original Mortgage
$103,297
Interest Rate
3.89%
Mortgage Type
VA
Purchase Details
Closed on
Jan 17, 1997
Sold by
Wofford Robert K and Wofford Christi A
Bought by
Wofford Scott B and Wofford Andrea J
Home Financials for this Owner
Home Financials are based on the most recent Mortgage that was taken out on this home.
Original Mortgage
$106,953
Interest Rate
7.46%
Mortgage Type
FHA
Create a Home Valuation Report for This Property
The Home Valuation Report is an in-depth analysis detailing your home's value as well as a comparison with similar homes in the area
Home Values in the Area
Average Home Value in this Area
Purchase History
| Date | Buyer | Sale Price | Title Company |
|---|---|---|---|
| Scott Kevin Christopher | $235,000 | First American Title Reno | |
| Wofford Scott B | -- | First American Title Ins | |
| Wofford Scott B | $107,000 | First Centennial Title Co |
Source: Public Records
Mortgage History
| Date | Status | Borrower | Loan Amount |
|---|---|---|---|
| Previous Owner | Scott Kevin Christopher | $4,747 | |
| Previous Owner | Wofford Scott B | $103,297 | |
| Previous Owner | Wofford Scott B | $106,953 |
Source: Public Records
Tax History Compared to Growth
Tax History
| Year | Tax Paid | Tax Assessment Tax Assessment Total Assessment is a certain percentage of the fair market value that is determined by local assessors to be the total taxable value of land and additions on the property. | Land | Improvement |
|---|---|---|---|---|
| 2025 | $1,298 | $61,894 | $30,065 | $31,829 |
| 2024 | $1,298 | $57,202 | $24,710 | $32,492 |
| 2023 | $1,202 | $59,678 | $28,665 | $31,013 |
| 2022 | $1,113 | $50,912 | $24,885 | $26,027 |
| 2021 | $1,031 | $43,221 | $17,010 | $26,211 |
| 2020 | $969 | $43,377 | $16,940 | $26,437 |
| 2019 | $922 | $41,223 | $15,435 | $25,788 |
| 2018 | $880 | $36,516 | $11,095 | $25,421 |
| 2017 | $844 | $35,319 | $9,660 | $25,659 |
| 2016 | $824 | $35,525 | $9,205 | $26,320 |
| 2015 | $604 | $33,960 | $7,455 | $26,505 |
| 2014 | $595 | $29,905 | $5,495 | $24,410 |
| 2013 | -- | $23,890 | $3,325 | $20,565 |
Source: Public Records
Map
Nearby Homes
- 3865 Fulmar Ct
- 3830 Petrel Ct
- 17475 Egret Ln
- 17530 Thrush Ln
- 17570 Thrush Ln
- 17523 Javalina Ct
- 17533 Javalina Ct
- 17507 Bear Lake Dr
- 3800 Sandpiper Dr
- 17702 Clear Springs Ct
- 3715 Sandpiper Dr
- 17862 Bear River Ct
- 3810 Bobolink Cir
- 115 Calistoga Ct
- 17160 Amethyst Dr
- 17105 Garnet Dr
- 17845 Owl Ct
- 4040 Goldfinch Dr
- 18260 Alderwood Ct
- 17940 Cold Springs Dr
- 3985 Peregrine Cir
- 3815 Brant St
- 3965 Peregrine Cir
- 3955 Peregrine Cir
- 3975 Peregrine Cir
- 3810 Brant St
- 3825 Brant St
- 3820 Brant St
- 3800 Brant St
- 3945 Peregrine Cir
- 3950 Peregrine Cir
- 3790 Brant St
- 3830 Brant St
- 3835 Brant St
- 3940 Peregrine Cir
- 3935 Peregrine Cir
- 3900 Peregrine Cir
- 3895 Shearwater Dr
- 3780 Brant St
- 3775 Brant St