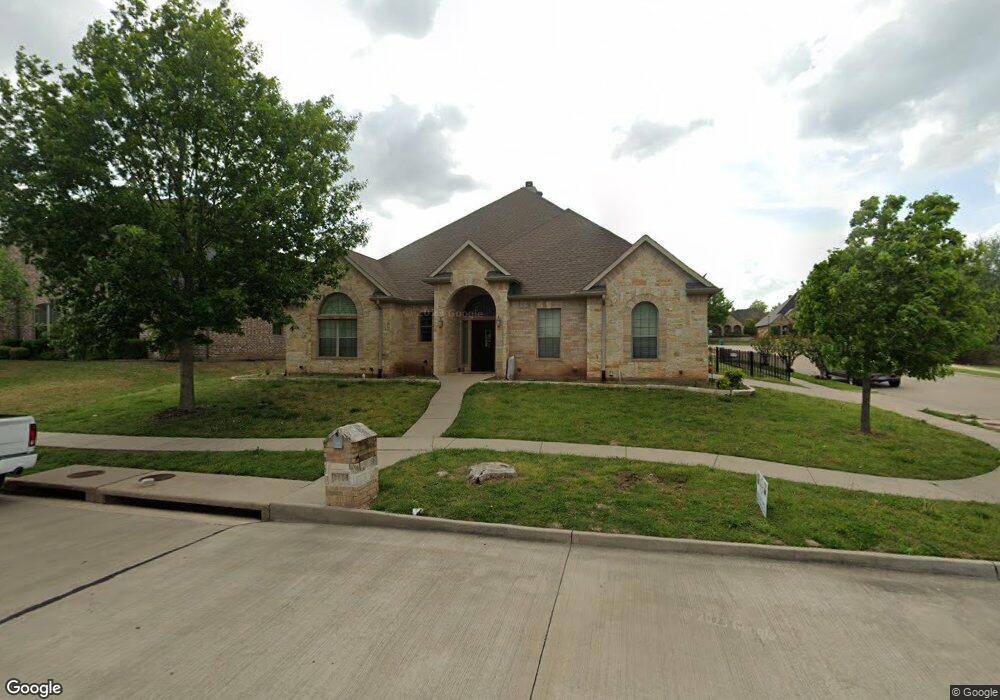
3806 Merrimac Rd Sherman, TX 75090
Estimated Value: $413,851 - $492,000
3
Beds
3
Baths
2,377
Sq Ft
$191/Sq Ft
Est. Value
About This Home
This home is located at 3806 Merrimac Rd, Sherman, TX 75090 and is currently estimated at $452,926, approximately $190 per square foot. 3806 Merrimac Rd is a home located in Grayson County with nearby schools including Percy W. Neblett Elementary School, Dillingham Intermediate School, and Piner Middle School.
Ownership History
Date
Name
Owned For
Owner Type
Purchase Details
Closed on
Jan 25, 2018
Bought by
Little Terri L
Current Estimated Value
Home Financials for this Owner
Home Financials are based on the most recent Mortgage that was taken out on this home.
Original Mortgage
$269,688
Outstanding Balance
$229,312
Interest Rate
4.15%
Estimated Equity
$223,614
Purchase Details
Closed on
Mar 10, 2016
Sold by
Baker Calvin L and Baker Martha
Bought by
Quinlan Ron
Purchase Details
Closed on
Oct 24, 2008
Sold by
Butterworth David and Butterworth Homes
Bought by
Baker Calvin L and Baker Martha
Home Financials for this Owner
Home Financials are based on the most recent Mortgage that was taken out on this home.
Original Mortgage
$184,800
Interest Rate
5.83%
Mortgage Type
Purchase Money Mortgage
Purchase Details
Closed on
Sep 6, 2007
Sold by
Cool Water Development Llp
Bought by
Butterworth David
Home Financials for this Owner
Home Financials are based on the most recent Mortgage that was taken out on this home.
Original Mortgage
$191,250
Interest Rate
6.7%
Mortgage Type
Purchase Money Mortgage
Create a Home Valuation Report for This Property
The Home Valuation Report is an in-depth analysis detailing your home's value as well as a comparison with similar homes in the area
Home Values in the Area
Average Home Value in this Area
Purchase History
| Date | Buyer | Sale Price | Title Company |
|---|---|---|---|
| Little Terri L | -- | -- | |
| Quinlan Ron | -- | None Available | |
| Baker Calvin L | -- | Chapin Title Co Inc | |
| Butterworth David | -- | Red River Title Co |
Source: Public Records
Mortgage History
| Date | Status | Borrower | Loan Amount |
|---|---|---|---|
| Open | Little Terri L | $269,688 | |
| Closed | Little Terri L | -- | |
| Previous Owner | Baker Calvin L | $184,800 | |
| Previous Owner | Butterworth David | $191,250 |
Source: Public Records
Tax History Compared to Growth
Tax History
| Year | Tax Paid | Tax Assessment Tax Assessment Total Assessment is a certain percentage of the fair market value that is determined by local assessors to be the total taxable value of land and additions on the property. | Land | Improvement |
|---|---|---|---|---|
| 2025 | $7,383 | $445,180 | $93,580 | $351,600 |
| 2024 | $8,893 | $405,462 | $0 | $0 |
| 2023 | $6,618 | $368,602 | $0 | $0 |
| 2022 | $7,853 | $335,093 | $0 | $0 |
| 2021 | $7,635 | $304,630 | $40,615 | $264,015 |
| 2020 | $7,664 | $292,011 | $40,615 | $251,396 |
| 2019 | $7,344 | $272,450 | $31,596 | $240,854 |
| 2018 | $7,008 | $279,348 | $31,596 | $247,752 |
| 2017 | $6,473 | $260,023 | $31,596 | $228,427 |
| 2016 | $6,349 | $256,262 | $31,596 | $224,666 |
| 2015 | $3,939 | $231,870 | $31,596 | $200,274 |
| 2014 | $4,018 | $213,512 | $31,596 | $181,916 |
Source: Public Records
Map
Nearby Homes
- 3707 Sumner Ct
- 1719 Moreland Dr
- 25 Luther Ln
- 95 Meadowlake
- TBD N Calais St
- 2.18 Acres E Sara Swamy Dr
- 1705 La Salle Dr
- 815 E Pecan Grove Rd
- 00000 Texoma Pkwy
- 000 Texoma Pkwy
- 805 La Salle Dr
- 1530 Texoma Pkwy
- 0000 Texoma Pkwy
- 3706 Heatherwood Ln
- 4812 Park Vista Blvd
- 1701 Verdi Ln
- 3707 Heatherwood Ln
- 1803 Verdi Ln
- 4819 Park Vista Blvd
- 914 Boone Dr
- 3802 Merrimac Rd
- 3719 Sumner Ct
- 3715 Sumner Ct
- 3803 Merrimac Rd
- 1709 Mahan Dr
- 3809 Sumner Ct
- 3811 Merrimac Rd
- 3715 Merrimac Rd
- 3710 Merrimac Rd
- TBD Sumner Ct
- 3815 Merrimac Rd
- 3815 Sumner Ct
- 3714 Sumner Ct
- 3711 Merrimac Rd
- 3819 Sumner Ct
- 3823 Sumner Ct
- 3718 Sumner Ct
- 3800 Sumner Ct
- 3806 Sumner Ct
- 1713 Pecan Grove Rd E