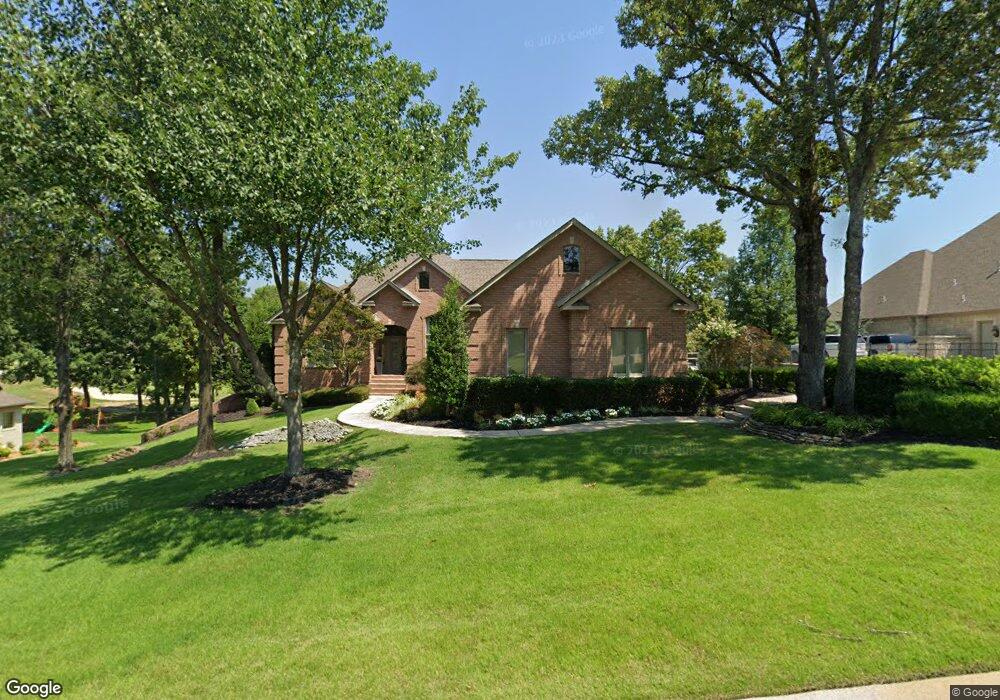
3806 Pebble Beach Dr Jonesboro, AR 72404
Estimated Value: $523,000 - $734,000
--
Bed
3
Baths
2,626
Sq Ft
$252/Sq Ft
Est. Value
About This Home
This home is located at 3806 Pebble Beach Dr, Jonesboro, AR 72404 and is currently estimated at $661,333, approximately $251 per square foot. 3806 Pebble Beach Dr is a home located in Craighead County with nearby schools including Valley View Elementary School, Valley View High School, and Ridgefield Christian School.
Ownership History
Date
Name
Owned For
Owner Type
Purchase Details
Closed on
Sep 28, 2012
Sold by
Finch Brandon and Finch Elizabeth
Bought by
Bookout Paul J and Bookout Sherry L
Current Estimated Value
Home Financials for this Owner
Home Financials are based on the most recent Mortgage that was taken out on this home.
Original Mortgage
$283,776
Outstanding Balance
$123,796
Interest Rate
3.7%
Mortgage Type
New Conventional
Estimated Equity
$537,537
Purchase Details
Closed on
Jun 22, 2009
Sold by
Smith Robert V and Smith Barbara H
Bought by
Finch Brandon and Finch Elizabeth
Home Financials for this Owner
Home Financials are based on the most recent Mortgage that was taken out on this home.
Original Mortgage
$380,000
Interest Rate
4.83%
Mortgage Type
New Conventional
Purchase Details
Closed on
Jan 18, 2002
Bought by
Smith
Create a Home Valuation Report for This Property
The Home Valuation Report is an in-depth analysis detailing your home's value as well as a comparison with similar homes in the area
Home Values in the Area
Average Home Value in this Area
Purchase History
| Date | Buyer | Sale Price | Title Company |
|---|---|---|---|
| Bookout Paul J | $485,000 | None Available | |
| Finch Brandon | $482,000 | Lenders Title Company | |
| Smith | $38,000 | -- |
Source: Public Records
Mortgage History
| Date | Status | Borrower | Loan Amount |
|---|---|---|---|
| Open | Bookout Paul J | $283,776 | |
| Previous Owner | Finch Brandon | $380,000 |
Source: Public Records
Tax History Compared to Growth
Tax History
| Year | Tax Paid | Tax Assessment Tax Assessment Total Assessment is a certain percentage of the fair market value that is determined by local assessors to be the total taxable value of land and additions on the property. | Land | Improvement |
|---|---|---|---|---|
| 2025 | $5,075 | $98,352 | $20,000 | $78,352 |
| 2024 | $5,075 | $98,352 | $20,000 | $78,352 |
| 2023 | $4,552 | $98,352 | $20,000 | $78,352 |
| 2022 | $4,415 | $98,352 | $20,000 | $78,352 |
| 2021 | $4,277 | $90,150 | $20,000 | $70,150 |
| 2020 | $4,277 | $90,150 | $20,000 | $70,150 |
| 2019 | $4,277 | $90,150 | $20,000 | $70,150 |
| 2018 | $4,302 | $90,150 | $20,000 | $70,150 |
| 2017 | $4,208 | $90,150 | $20,000 | $70,150 |
| 2016 | $3,991 | $84,130 | $15,000 | $69,130 |
| 2015 | $4,341 | $84,130 | $15,000 | $69,130 |
| 2014 | $3,991 | $84,130 | $15,000 | $69,130 |
Source: Public Records
Map
Nearby Homes
- 3821 Pebble Beach Dr
- 2313 Sea Island Dr
- 3821 Riviera Dr
- 2323 Summit Oaks Cove
- 2321 Grand Oaks Cove
- 2320 Sea Island Dr
- 3625 Riviera Dr
- 3617 Riviera Dr
- 4008 Sloan Lake Cove
- 2064 Sloan Lake Dr
- 3610 Sawgrass Dr
- 3705 Sawgrass Dr
- 2706 Ridgepointe Dr
- 4007 Ridgepointe Cove
- 4000 Ridgepointe Cove
- 2911 Ridgepointe Dr
- 3623 Lacoste Dr
- 2213 Doral Dr
- 3 Damron Dr
- 3-Acres Damron Dr
- 3810 Pebble Beach Dr
- 3800 Pebble Beach Dr
- 3811 Pebble Beach Dr
- 3805 Pebble Beach Dr
- 3809 Pebble Beach Dr
- 3801 Pebble Beach Dr
- 3814 Pebble Beach Dr
- 3813 Pebble Beach Dr
- 3734 Pebble Beach Dr
- 3817 Pebble Beach Dr
- 3732 Pebble Beach Dr
- 2305 Sea Island Dr
- 3730 Pebble Beach Dr
- 3737 Pebble Beach Dr
- 3736 Pebble Beach Dr
- 3818 Pebble Beach Dr
- 3728 Pebble Beach Dr
- 0 Sea Island Dr Unit 17007917
- 2309 Sea Island Dr
- 3726 Pebble Beach Dr