Estimated Value: $599,000 - $697,000
5
Beds
4
Baths
1,708
Sq Ft
$375/Sq Ft
Est. Value
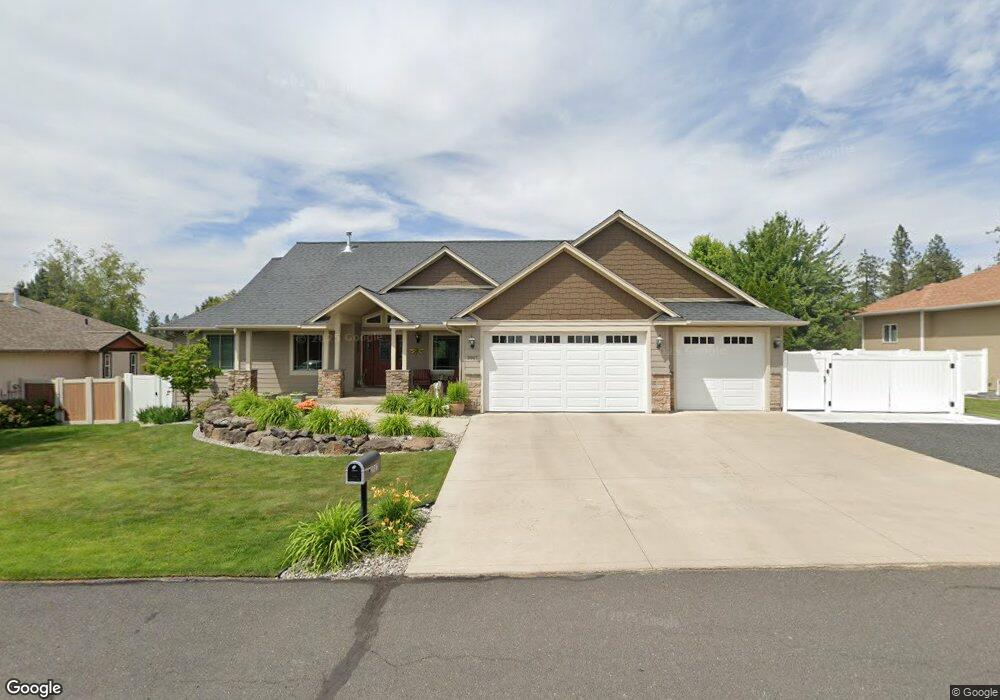
About This Home
This home is located at 3807 E Thrush Ln, Mead, WA 99021 and is currently estimated at $640,521, approximately $375 per square foot. 3807 E Thrush Ln is a home located in Spokane County with nearby schools including Meadow Ridge Elementary School, Mountainside Middle School, and Mt. Spokane High School.
Ownership History
Date
Name
Owned For
Owner Type
Purchase Details
Closed on
Jun 10, 2021
Sold by
Whitener Sheila Elaine and Whitener Sheila E
Bought by
Whitener Sheila E and Whitener Sheila Elaine
Current Estimated Value
Purchase Details
Closed on
Aug 10, 2018
Sold by
Whitener Sheila Elaine
Bought by
Whitener Sheila Elaine
Home Financials for this Owner
Home Financials are based on the most recent Mortgage that was taken out on this home.
Original Mortgage
$2,240,000
Interest Rate
4.5%
Mortgage Type
Commercial
Purchase Details
Closed on
Feb 19, 2007
Sold by
Saxton Ayers Development Inc
Bought by
Venezia Dione L
Home Financials for this Owner
Home Financials are based on the most recent Mortgage that was taken out on this home.
Original Mortgage
$264,000
Interest Rate
6.37%
Mortgage Type
Purchase Money Mortgage
Purchase Details
Closed on
Jun 26, 2003
Sold by
Bartleson Robert H
Bought by
Saxton Ayers Development Inc
Create a Home Valuation Report for This Property
The Home Valuation Report is an in-depth analysis detailing your home's value as well as a comparison with similar homes in the area
Home Values in the Area
Average Home Value in this Area
Purchase History
| Date | Buyer | Sale Price | Title Company |
|---|---|---|---|
| Whitener Sheila E | -- | None Listed On Document | |
| Whitener Sheila Elaine | $287,890 | None Available | |
| Venezia Dione L | $330,000 | First American Title Ins | |
| Saxton Ayers Development Inc | -- | Spokane County Title Co |
Source: Public Records
Mortgage History
| Date | Status | Borrower | Loan Amount |
|---|---|---|---|
| Previous Owner | Whitener Sheila Elaine | $2,240,000 | |
| Previous Owner | Venezia Dione L | $264,000 |
Source: Public Records
Tax History
| Year | Tax Paid | Tax Assessment Tax Assessment Total Assessment is a certain percentage of the fair market value that is determined by local assessors to be the total taxable value of land and additions on the property. | Land | Improvement |
|---|---|---|---|---|
| 2025 | $634 | $604,200 | $110,000 | $494,200 |
| 2024 | $634 | $608,000 | $90,000 | $518,000 |
| 2023 | $1,081 | $599,800 | $90,000 | $509,800 |
| 2022 | $1,297 | $571,200 | $95,000 | $476,200 |
| 2021 | $4,314 | $408,200 | $60,000 | $348,200 |
| 2020 | $3,943 | $353,800 | $55,000 | $298,800 |
| 2019 | $3,026 | $273,500 | $40,000 | $233,500 |
| 2018 | $3,495 | $265,300 | $40,000 | $225,300 |
| 2017 | $3,228 | $246,700 | $40,000 | $206,700 |
| 2016 | $3,294 | $246,500 | $40,000 | $206,500 |
| 2015 | $3,084 | $237,000 | $40,000 | $197,000 |
| 2014 | -- | $225,200 | $40,000 | $185,200 |
| 2013 | -- | $0 | $0 | $0 |
Source: Public Records
Map
Nearby Homes
- 3912 E Siskin Ln
- 4712 E Winfield Ct
- 15204 N Chesapeake Rd
- 2908 E Clover Park Ave
- 3756 E Nyberg Ln Unit Lot 17
- 3928 E Lane Park Rd Unit 30
- 4601 E Pineglen Rd
- 3611 E Pine Needle Ave
- 15317 N Hunters Pointe
- 3103 E Vicksburg Ln
- 3419 E Garrison Ln
- 4518 E Lane Park Rd
- 3810 E Evan Ln
- 14826 N Mcclean Ln
- 177XX N Saddle Hill Rd
- 15908 N Azure Dr
- 14725 N Mcclean Ln
- 17917 N Saddle Hill Rd
- 17925 N Kimberly Rd
- 4620 E Handy Rd
- 3719 E Thrush Ln
- 3815 E Thrush Ln
- 3806 E Thrush Ln
- 16000 N Sycamore St
- 3713 E Thrush Ln
- 3819 E Thrush Ln
- 3812 E Thrush Ln
- 3716 E Thrush Ln
- 3818 E Thrush Ln
- 16020 N Sycamore St
- 3705 E Thrush Ln
- 3710 E Thrush Ln
- 3905 E Thrush Ln
- 3902 E Thrush Ln
- 3805 E Siskin Ln
- 3811 E Siskin Ln
- 3717 E Siskin Ln
- 3704 E Thrush Ln
- 16220 N Sycamore St
- 3821 E Siskin Ln
Your Personal Tour Guide
Ask me questions while you tour the home.