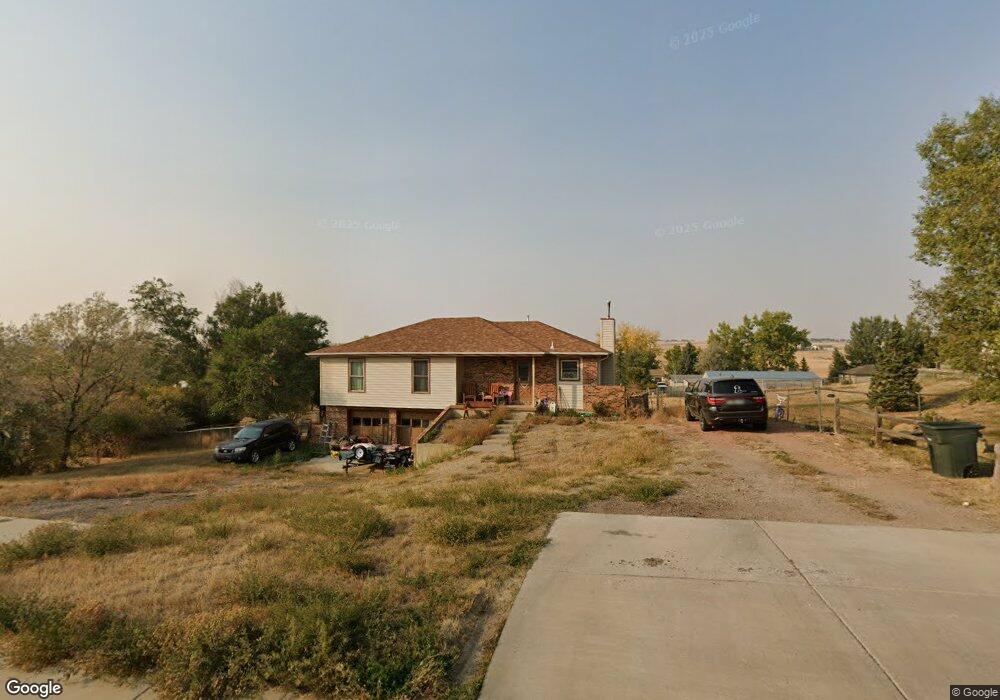
3808 Force Rd Gillette, WY 82718
Estimated Value: $326,000 - $394,000
3
Beds
2
Baths
1,200
Sq Ft
$293/Sq Ft
Est. Value
About This Home
This home is located at 3808 Force Rd, Gillette, WY 82718 and is currently estimated at $352,160, approximately $293 per square foot. 3808 Force Rd is a home located in Campbell County with nearby schools including Westwood High School, Pronghorn Elementary School, and Sage Valley Junior High School.
Ownership History
Date
Name
Owned For
Owner Type
Purchase Details
Closed on
Apr 27, 2011
Sold by
Petersen Joshua D and Petersen Megan L
Bought by
Skinner Kyle R and Skinner Kasi M
Current Estimated Value
Home Financials for this Owner
Home Financials are based on the most recent Mortgage that was taken out on this home.
Original Mortgage
$198,150
Outstanding Balance
$137,324
Interest Rate
4.82%
Mortgage Type
VA
Estimated Equity
$214,836
Purchase Details
Closed on
Aug 6, 2010
Sold by
Petersen Joshua D and Petersen Megan L
Bought by
Petersen Joshua D and Petersen Megan L
Home Financials for this Owner
Home Financials are based on the most recent Mortgage that was taken out on this home.
Original Mortgage
$166,002
Interest Rate
4.5%
Mortgage Type
FHA
Purchase Details
Closed on
Jun 10, 2006
Sold by
Petersen Joshua D and Petersen Megan L
Bought by
Petersen Joshua D and Petersen Megan L
Create a Home Valuation Report for This Property
The Home Valuation Report is an in-depth analysis detailing your home's value as well as a comparison with similar homes in the area
Purchase History
| Date | Buyer | Sale Price | Title Company |
|---|---|---|---|
| Skinner Kyle R | -- | None Available | |
| Petersen Joshua D | -- | None Available | |
| Petersen Joshua D | -- | None Available |
Source: Public Records
Mortgage History
| Date | Status | Borrower | Loan Amount |
|---|---|---|---|
| Open | Skinner Kyle R | $198,150 | |
| Previous Owner | Petersen Joshua D | $166,002 |
Source: Public Records
Tax History
| Year | Tax Paid | Tax Assessment Tax Assessment Total Assessment is a certain percentage of the fair market value that is determined by local assessors to be the total taxable value of land and additions on the property. | Land | Improvement |
|---|---|---|---|---|
| 2025 | $1,674 | $18,154 | $4,548 | $13,606 |
| 2024 | $17 | $23,805 | $5,831 | $17,974 |
| 2023 | $1,621 | $23,045 | $5,322 | $17,723 |
| 2022 | $1,419 | $20,115 | $3,420 | $16,695 |
| 2021 | $1,369 | $20,063 | $3,420 | $16,643 |
| 2020 | $1,347 | $19,795 | $3,420 | $16,375 |
| 2019 | $1,270 | $18,707 | $3,420 | $15,287 |
| 2018 | $1,215 | $17,975 | $3,420 | $14,555 |
| 2017 | $1,197 | $17,741 | $3,420 | $14,321 |
| 2016 | $1,208 | $17,885 | $3,420 | $14,465 |
| 2015 | -- | $17,108 | $2,618 | $14,490 |
| 2014 | -- | $16,235 | $2,618 | $13,617 |
Source: Public Records
Map
Nearby Homes
- 370 Wyoming 50
- 4390 Crestfield Ave
- 3700 Sun Dancer Ct
- Tbd Pronghorn Ranch
- 2307 Big Lost Dr
- Lot 3 Moonshiner Ln
- 3000 W Lakeway Rd
- 4000 Overdale Dr
- 6001 Stone Gate Ave
- 4105 Brorby Blvd
- 4205 Lexington Ave
- 3306 Sutherland Dr
- 1014 Pioneer Ave
- 3113 Sutherland Dr -
- 609 Express Dr
- 4461 Running Dr W
- 904 Clarion Dr
- 4601 Running Dr W
- 1105 W Beaver Dr
- 905 Sako Dr
- 3804 Force Rd
- 3902 Force Rd
- 3811 Hidden Valley Rd
- 3802 Force Rd
- 3906 Force Rd
- 3903 Hidden Valley Rd
- 3807 Hidden Valley Rd
- 4400 Wilson Way
- 4400 Wilson Way -
- 3811 Hidden Valley Rd -
- 3907 Hidden Valley Rd
- 3910 Force Rd
- 3708 Force Rd
- 4403 Doud Dr
- 3801 Hidden Valley Rd
- 4404 Wilson Way
- 3709 Hidden Valley Rd
- 4401 Wilson Way
- 3911 Hidden Valley Rd
- 4000 Force Rd
Your Personal Tour Guide
Ask me questions while you tour the home.