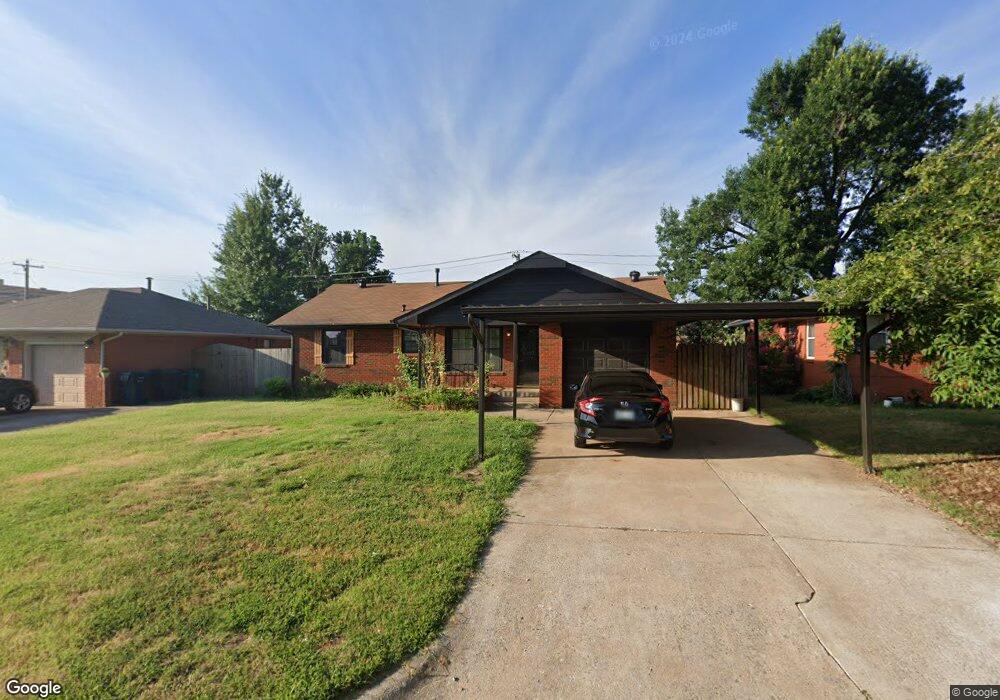
3808 NW 56th St Oklahoma City, OK 73112
Coronado Heights NeighborhoodEstimated Value: $167,000 - $180,325
3
Beds
1
Bath
1,152
Sq Ft
$152/Sq Ft
Est. Value
About This Home
This home is located at 3808 NW 56th St, Oklahoma City, OK 73112 and is currently estimated at $174,581, approximately $151 per square foot. 3808 NW 56th St is a home located in Oklahoma County with nearby schools including Coronado Heights Elementary School, James L. Capps Middle School, and Putnam City High School.
Ownership History
Date
Name
Owned For
Owner Type
Purchase Details
Closed on
Oct 13, 2022
Sold by
Nguyen Huong Thi
Bought by
Nguyen Christina T
Current Estimated Value
Purchase Details
Closed on
Nov 7, 2021
Sold by
Trinh Tong Kim and Estate Of Tong Kim Trinh
Bought by
Nguyen Christina T and Nguyen Huong
Home Financials for this Owner
Home Financials are based on the most recent Mortgage that was taken out on this home.
Original Mortgage
$189,000
Interest Rate
2.8%
Mortgage Type
Future Advance Clause Open End Mortgage
Purchase Details
Closed on
Oct 18, 2021
Sold by
Trinh Tong Kim
Bought by
Nguyen Christina T and Nguyen Huong T
Home Financials for this Owner
Home Financials are based on the most recent Mortgage that was taken out on this home.
Original Mortgage
$189,000
Interest Rate
2.8%
Mortgage Type
Future Advance Clause Open End Mortgage
Purchase Details
Closed on
Nov 26, 2018
Sold by
Trinh Tong Kim
Bought by
Trinh Tong Kim and Estate Of Tong Kim Trinh
Create a Home Valuation Report for This Property
The Home Valuation Report is an in-depth analysis detailing your home's value as well as a comparison with similar homes in the area
Home Values in the Area
Average Home Value in this Area
Purchase History
| Date | Buyer | Sale Price | Title Company |
|---|---|---|---|
| Nguyen Christina T | -- | -- | |
| Nguyen Christina T | -- | None Available | |
| Nguyen Christina T | -- | None Available | |
| Trinh Tong Kim | -- | None Available |
Source: Public Records
Mortgage History
| Date | Status | Borrower | Loan Amount |
|---|---|---|---|
| Previous Owner | Nguyen Christina T | $189,000 |
Source: Public Records
Tax History Compared to Growth
Tax History
| Year | Tax Paid | Tax Assessment Tax Assessment Total Assessment is a certain percentage of the fair market value that is determined by local assessors to be the total taxable value of land and additions on the property. | Land | Improvement |
|---|---|---|---|---|
| 2024 | $1,901 | $16,371 | $2,869 | $13,502 |
| 2023 | $1,901 | $15,592 | $1,992 | $13,600 |
| 2022 | $1,833 | $14,850 | $2,115 | $12,735 |
| 2021 | $1,346 | $12,014 | $1,949 | $10,065 |
| 2020 | $1,298 | $11,665 | $2,011 | $9,654 |
| 2019 | $1,238 | $11,326 | $1,669 | $9,657 |
| 2018 | $1,200 | $10,997 | $0 | $0 |
| 2017 | $1,163 | $10,675 | $1,700 | $8,975 |
| 2016 | $1,124 | $10,364 | $1,738 | $8,626 |
| 2015 | $1,101 | $10,062 | $1,945 | $8,117 |
| 2014 | $1,061 | $10,077 | $1,945 | $8,132 |
Source: Public Records
Map
Nearby Homes
- 3917 NW 55th St
- 5521 N Shawnee Ave
- 5209 N Roff Ave
- 3820 NW 51st Place
- 3736 NW 59th St
- 5906 N Shawnee Ave
- 3609 NW 53rd St
- 3717 NW 59th St
- 4124 NW 56th St
- 3541 NW 52nd St
- 4117 NW 56th Place
- 4009 NW 59th St
- 4129 NW 57th St
- 3524 NW 51st St
- 4129 NW 51st St
- 3510 NW 52nd St
- 4219 NW 58th St
- 4813 Larissa Ln
- 4312 NW 56th Terrace
- 4124 NW 61st Terrace
- 3804 NW 56th St
- 3812 NW 56th St
- 3800 NW 56th St
- 3816 NW 56th St
- 3909 NW 55th St
- 3913 NW 55th St
- 3905 NW 55th St
- 3809 NW 56th St
- 3805 NW 56th St
- 3813 NW 56th St
- 3900 NW 56th St
- 3921 NW 55th St
- 3801 NW 56th St
- 3817 NW 56th St
- 3904 NW 56th St
- 3826 SE 56th St
- 2713 NW 55th St
- 3901 NW 56th St
- 5616 N Roff Ave
- 5612 N Roff Ave