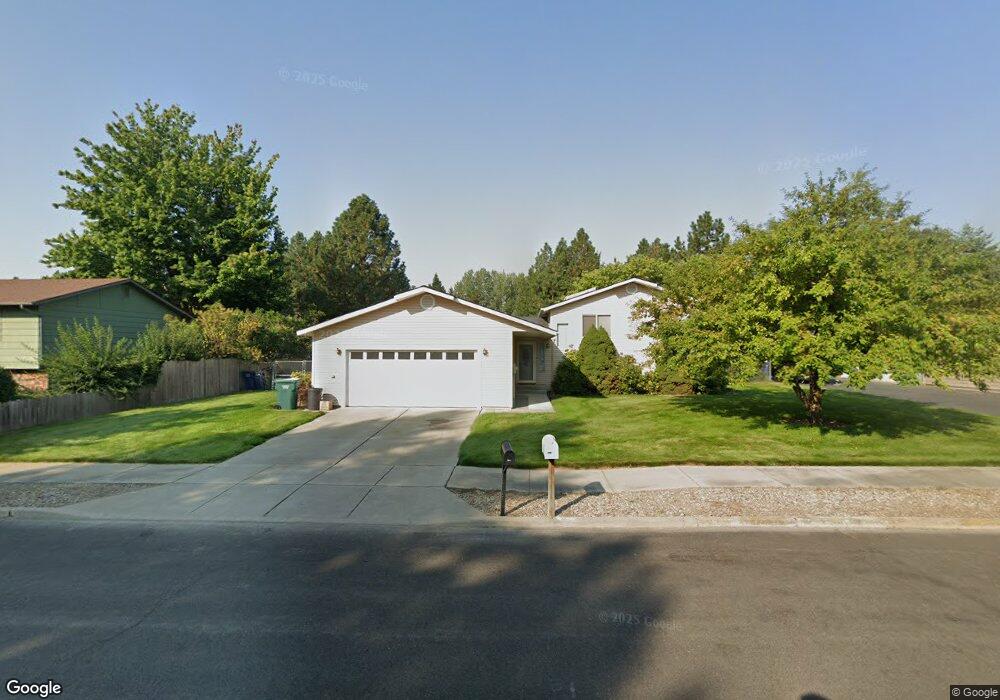
3809 Sherwood Dr Coeur D Alene, ID 83815
Ramsey-Woodland NeighborhoodEstimated Value: $502,431 - $522,000
4
Beds
3
Baths
1,844
Sq Ft
$278/Sq Ft
Est. Value
About This Home
This home is located at 3809 Sherwood Dr, Coeur D Alene, ID 83815 and is currently estimated at $512,108, approximately $277 per square foot. 3809 Sherwood Dr is a home located in Kootenai County with nearby schools including Winton Elementary School, Lakes Magnet Middle School, and Lake City High School.
Ownership History
Date
Name
Owned For
Owner Type
Purchase Details
Closed on
Jan 24, 2017
Sold by
Shagina Jordan Andrea
Bought by
Jessup Steven I
Current Estimated Value
Home Financials for this Owner
Home Financials are based on the most recent Mortgage that was taken out on this home.
Original Mortgage
$204,250
Outstanding Balance
$169,582
Interest Rate
4.3%
Mortgage Type
New Conventional
Estimated Equity
$342,526
Purchase Details
Closed on
Jul 19, 2012
Sold by
Shagina Steve F and Shagina Denise R
Bought by
Shagina Steven F
Purchase Details
Closed on
Mar 21, 2007
Sold by
Hagina Steven and Hagina Denise R
Bought by
Shagina Steve F and Shagina Denise R
Home Financials for this Owner
Home Financials are based on the most recent Mortgage that was taken out on this home.
Original Mortgage
$182,000
Interest Rate
6.31%
Mortgage Type
New Conventional
Create a Home Valuation Report for This Property
The Home Valuation Report is an in-depth analysis detailing your home's value as well as a comparison with similar homes in the area
Home Values in the Area
Average Home Value in this Area
Purchase History
| Date | Buyer | Sale Price | Title Company |
|---|---|---|---|
| Jessup Steven I | -- | First American Title Kootena | |
| Shagina Steven F | -- | None Available | |
| Shagina Steve F | -- | -- |
Source: Public Records
Mortgage History
| Date | Status | Borrower | Loan Amount |
|---|---|---|---|
| Open | Jessup Steven I | $204,250 | |
| Previous Owner | Shagina Steve F | $182,000 |
Source: Public Records
Tax History Compared to Growth
Tax History
| Year | Tax Paid | Tax Assessment Tax Assessment Total Assessment is a certain percentage of the fair market value that is determined by local assessors to be the total taxable value of land and additions on the property. | Land | Improvement |
|---|---|---|---|---|
| 2024 | $1,488 | $421,972 | $190,000 | $231,972 |
| 2023 | $1,488 | $469,258 | $212,750 | $256,508 |
| 2022 | $1,967 | $496,024 | $212,750 | $283,274 |
| 2021 | $1,578 | $304,704 | $115,000 | $189,704 |
| 2020 | $1,464 | $262,281 | $96,014 | $166,267 |
| 2019 | $1,571 | $243,547 | $87,285 | $156,262 |
| 2018 | $1,285 | $203,280 | $79,350 | $123,930 |
| 2017 | $1,287 | $190,160 | $69,000 | $121,160 |
| 2016 | $1,251 | $174,920 | $60,000 | $114,920 |
| 2015 | $1,176 | $158,655 | $51,975 | $106,680 |
| 2013 | $1,100 | $134,970 | $39,600 | $95,370 |
Source: Public Records
Map
Nearby Homes
- 3809 N Moccasin Rd
- 5135 N Abbey Ct
- NNA Highland Dr
- 3639 W Pineridge Dr
- 3639 W Hillcrest Cir
- 3191 Sherwood Dr
- 3279 W Peartree Rd
- 5065 N Stonehenge Ave
- 3200 Wedgewood Loop
- 3102 Buckskin Rd
- 2818 W Fairway Place
- 3823 N Player Dr
- 2840 W Masters Dr
- 3867 W Fairway Dr
- 2239 W Shawna Ave
- 2852 W Fairway Dr
- 2489 W Plymouth Cir
- 2867 W Tours Dr
- 3299 N Rosalia Rd
- 2243 W Oxford Cir
- 3815 N Sherwood Dr
- 3805 N Sherwood Dr
- 3804 N Tamarack Rd
- 3812 Sherwood Dr
- 3816 N Sherwood Dr
- 3819 Sherwood Dr
- 3808 Sherwood Dr
- 3820 N Sherwood Dr
- 3804 N Sherwood Dr
- 3808 N Tamarack Rd
- 3711 N Sherwood Dr
- 3903 Sherwood Dr
- 3708 N Tamarack Rd
- 3809 Belmont Rd
- 3716 N Sherwood Dr
- 3815 N Belmont Rd
- 3902 N Sherwood Dr
- 3803 N Belmont Rd
- 3821 N Belmont Rd
- 3805 N Tamarack Rd