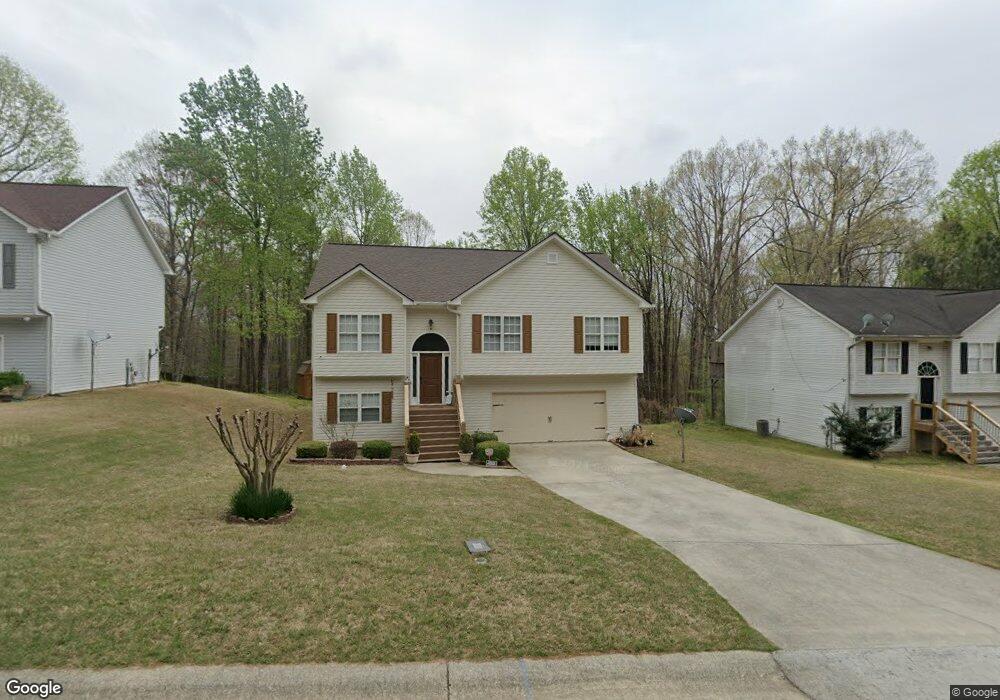
3809 Valley Creek Dr Flowery Branch, GA 30542
Estimated Value: $302,000 - $334,000
3
Beds
2
Baths
1,267
Sq Ft
$252/Sq Ft
Est. Value
About This Home
This home is located at 3809 Valley Creek Dr, Flowery Branch, GA 30542 and is currently estimated at $318,836, approximately $251 per square foot. 3809 Valley Creek Dr is a home located in Hall County with nearby schools including Martin Elementary School, Southwest Middle School, and C.W. Davis Middle School.
Ownership History
Date
Name
Owned For
Owner Type
Purchase Details
Closed on
May 31, 2008
Sold by
Londono Carlos
Bought by
Londono Lilianae
Current Estimated Value
Purchase Details
Closed on
Nov 26, 2002
Sold by
Londono Carlos and Osorio Lili
Bought by
Londono Carlos
Home Financials for this Owner
Home Financials are based on the most recent Mortgage that was taken out on this home.
Original Mortgage
$124,606
Interest Rate
6.08%
Mortgage Type
New Conventional
Purchase Details
Closed on
Dec 21, 2000
Sold by
Londono Carlos
Bought by
Londono Carlos
Home Financials for this Owner
Home Financials are based on the most recent Mortgage that was taken out on this home.
Original Mortgage
$123,650
Interest Rate
7.75%
Mortgage Type
FHA
Purchase Details
Closed on
Sep 21, 2000
Sold by
R&M Developers Inc
Bought by
Cooley Christopher T
Create a Home Valuation Report for This Property
The Home Valuation Report is an in-depth analysis detailing your home's value as well as a comparison with similar homes in the area
Home Values in the Area
Average Home Value in this Area
Purchase History
| Date | Buyer | Sale Price | Title Company |
|---|---|---|---|
| Londono Lilianae | -- | -- | |
| Londono Carlos | -- | -- | |
| Londono Carlos | -- | -- | |
| Londono Carlos | $123,800 | -- | |
| Cooley Christopher T | $45,000 | -- |
Source: Public Records
Mortgage History
| Date | Status | Borrower | Loan Amount |
|---|---|---|---|
| Previous Owner | Londono Carlos | $124,606 | |
| Previous Owner | Londono Carlos | $123,650 |
Source: Public Records
Tax History Compared to Growth
Tax History
| Year | Tax Paid | Tax Assessment Tax Assessment Total Assessment is a certain percentage of the fair market value that is determined by local assessors to be the total taxable value of land and additions on the property. | Land | Improvement |
|---|---|---|---|---|
| 2024 | $2,488 | $96,924 | $14,640 | $82,284 |
| 2023 | $2,328 | $106,144 | $14,640 | $91,504 |
| 2022 | $2,063 | $76,520 | $12,960 | $63,560 |
| 2021 | $1,714 | $61,800 | $7,760 | $54,040 |
| 2020 | $1,691 | $59,280 | $7,760 | $51,520 |
| 2019 | $1,727 | $60,120 | $7,520 | $52,600 |
| 2018 | $1,672 | $56,280 | $7,520 | $48,760 |
| 2017 | $1,246 | $41,640 | $7,520 | $34,120 |
| 2016 | $1,218 | $41,640 | $7,520 | $34,120 |
| 2015 | $889 | $29,422 | $4,520 | $24,902 |
| 2014 | $889 | $29,422 | $4,520 | $24,902 |
Source: Public Records
Map
Nearby Homes
- 3582 Winder Hwy
- 4086 Parks Rd
- 3929 Perry Ln
- 4020 Parks Rd
- 3617 Winder Hwy
- 4838 Netherlands Place
- 4743 Amsterdam Ln
- 4021 Laurant Path
- 4013 Laurant Path
- 3969 Bolding Rd
- Wakehurst Plan at Falls Creek
- 3935 Alderstone Dr
- Sheridan Plan at Falls Creek
- Avera Plan at Falls Creek
- Atwood Plan at Falls Creek
- Trenton Plan at Falls Creek
- Prescott Plan at Falls Creek
- Ingram Plan at Falls Creek
- Fairfield Plan at Falls Creek
- Denton Plan at Falls Creek
- 3813 Valley Creek Dr
- 3805 Valley Creek Dr
- 3817 Valley Creek Dr
- 3801 Valley Creek Dr
- 3730 Windsong Chase
- 3723 Legacy Walk Dr
- 3733 Windsong Chase
- 3820 Valley Creek Dr
- 3721 Valley Creek Dr
- 3825 Valley Creek Dr
- 3739 Chesapeake Trace Ln Unit 52
- 3739 Chesapeake Trace Ln
- 3735 Chesapeake Trace Ln
- 3824 Valley Creek Dr
- 3727 Windsong Chase
- 0 Windsong Chase Camp
- 3743 Chesapeake Trace Ln
- 3720 Legacy Walk Dr
- 3729 Legacy Walk Dr
- 3747 Chesapeake Trace Ln