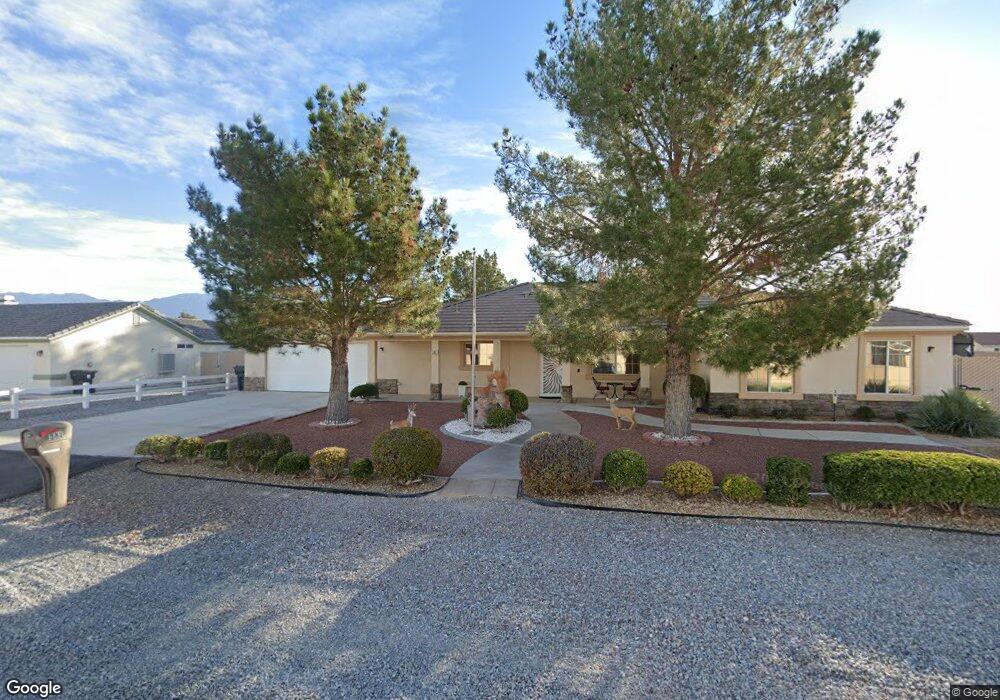
381 Big 5 Rd Pahrump, NV 89048
Estimated Value: $367,977 - $420,000
--
Bed
--
Bath
1,847
Sq Ft
$213/Sq Ft
Est. Value
About This Home
This home is located at 381 Big 5 Rd, Pahrump, NV 89048 and is currently estimated at $392,994, approximately $212 per square foot. 381 Big 5 Rd is a home located in Nye County with nearby schools including J.G. Johnson Elementary School, Rosemary Clarke Middle School, and Pahrump Valley High School.
Ownership History
Date
Name
Owned For
Owner Type
Purchase Details
Closed on
Mar 13, 2024
Sold by
Buckley Carolyn S
Bought by
Carolyn S Buckley Family Trust
Current Estimated Value
Purchase Details
Closed on
Mar 10, 2014
Sold by
Patterson Melvin R
Bought by
Patterson Family Trust
Home Financials for this Owner
Home Financials are based on the most recent Mortgage that was taken out on this home.
Original Mortgage
$170,445
Interest Rate
4.3%
Mortgage Type
VA
Purchase Details
Closed on
Feb 25, 2014
Sold by
Patterson Melvin R and May Billie Rae
Bought by
Buckley Thomas R and Buckley Carolyn S
Home Financials for this Owner
Home Financials are based on the most recent Mortgage that was taken out on this home.
Original Mortgage
$170,445
Interest Rate
4.3%
Mortgage Type
VA
Create a Home Valuation Report for This Property
The Home Valuation Report is an in-depth analysis detailing your home's value as well as a comparison with similar homes in the area
Home Values in the Area
Average Home Value in this Area
Purchase History
| Date | Buyer | Sale Price | Title Company |
|---|---|---|---|
| Carolyn S Buckley Family Trust | -- | None Listed On Document | |
| Patterson Family Trust | -- | -- | |
| Patterson Family Trust | -- | -- | |
| Buckley Thomas R | $185,000 | Markem Title Company |
Source: Public Records
Mortgage History
| Date | Status | Borrower | Loan Amount |
|---|---|---|---|
| Previous Owner | Buckley Thomas R | $170,445 |
Source: Public Records
Tax History Compared to Growth
Tax History
| Year | Tax Paid | Tax Assessment Tax Assessment Total Assessment is a certain percentage of the fair market value that is determined by local assessors to be the total taxable value of land and additions on the property. | Land | Improvement |
|---|---|---|---|---|
| 2025 | $126 | $74,585 | $3,618 | $70,967 |
| 2024 | $126 | $74,479 | $3,618 | $70,861 |
| 2023 | $126 | $68,968 | $3,618 | $65,350 |
| 2022 | $228 | $62,795 | $3,618 | $59,177 |
| 2021 | $249 | $59,983 | $2,894 | $57,089 |
| 2020 | $227 | $31,213 | $2,894 | $57,119 |
| 2019 | $135 | $64,436 | $2,894 | $61,542 |
| 2018 | $138 | $61,819 | $2,315 | $59,504 |
| 2017 | $129 | $49,695 | $2,315 | $47,380 |
| 2016 | $107 | $37,867 | $2,315 | $35,552 |
| 2015 | $119 | $34,584 | $2,315 | $32,269 |
| 2014 | $974 | $29,502 | $2,315 | $27,187 |
Source: Public Records
Map
Nearby Homes
- 61 Montecito Dr
- 311 Inverness Ave
- 320 Riviera Dr
- 360 Inverness Ave
- 30 Diamond Bar Rd
- 31 Tenderfoot Trail
- 356 Saint Andrew St
- 410 Candle Stick Ave
- 881 Montecito Dr
- 410 Montecito Dr
- 581 Montecito Dr
- 90 Mondale Ct
- 231 Weeping Willow Ct
- 210 S Magnolia Blvd
- 170 Magnolia Blvd
- 361 Slater Cir
- 401 Olive Branch Ln
- 781 Buol Rd
- 271 W Comstock Cir N
- 280 W Bonnie Claire Ct
- 381 Big Five Rd
- 401 Big Five Rd
- 401 Big 5 Rd
- 361 Big 5 Rd
- 361 Big Five Rd
- 380 Bullseye Ct
- 360 Dylan Place
- 131 Montecito Dr
- 151 Montecito Dr
- 121 Montecito Dr
- 421 Big Five Rd
- 421 Big 5 Rd
- 161 Montecito Dr
- 341 Big Five Rd
- 341 Big 5 Rd
- 111 Montecito Dr
- 171 Montecito Dr
- 400 Bullseye Ct
- 340 Dylan Place
- 210 Diamond Bar Rd