381 Bruning Rd New Hartford, CT 06057
Estimated Value: $502,000 - $535,000
3
Beds
2
Baths
1,848
Sq Ft
$280/Sq Ft
Est. Value
About This Home
This home is located at 381 Bruning Rd, New Hartford, CT 06057 and is currently estimated at $517,030, approximately $279 per square foot. 381 Bruning Rd is a home located in Litchfield County with nearby schools including Ann Antolini School, Northwestern Regional Middle School, and Northwestern Regional High School.
Ownership History
Date
Name
Owned For
Owner Type
Purchase Details
Closed on
Sep 4, 2007
Sold by
Lasalle Bank Na
Bought by
Tretyak Aleksandr and Tretyak Svetlana
Current Estimated Value
Home Financials for this Owner
Home Financials are based on the most recent Mortgage that was taken out on this home.
Original Mortgage
$192,000
Interest Rate
6.71%
Purchase Details
Closed on
Dec 17, 2004
Sold by
Geneau Valdor and Geneau Barbara
Bought by
Puls Brian
Home Financials for this Owner
Home Financials are based on the most recent Mortgage that was taken out on this home.
Original Mortgage
$365,000
Interest Rate
7.05%
Purchase Details
Closed on
Mar 6, 2002
Sold by
Boucher Bldg & Renovat
Bought by
Geneau Valdar and Geneau Barbara
Purchase Details
Closed on
Aug 21, 2001
Sold by
Truszkowski Joseph J
Bought by
Boucher Bldg & Renovatns
Create a Home Valuation Report for This Property
The Home Valuation Report is an in-depth analysis detailing your home's value as well as a comparison with similar homes in the area
Home Values in the Area
Average Home Value in this Area
Purchase History
| Date | Buyer | Sale Price | Title Company |
|---|---|---|---|
| Tretyak Aleksandr | $240,000 | -- | |
| Puls Brian | $365,000 | -- | |
| Geneau Valdar | $235,303 | -- | |
| Boucher Bldg & Renovatns | $25,000 | -- |
Source: Public Records
Mortgage History
| Date | Status | Borrower | Loan Amount |
|---|---|---|---|
| Open | Boucher Bldg & Renovatns | $183,688 | |
| Closed | Boucher Bldg & Renovatns | $192,000 | |
| Previous Owner | Boucher Bldg & Renovatns | $365,000 |
Source: Public Records
Tax History Compared to Growth
Tax History
| Year | Tax Paid | Tax Assessment Tax Assessment Total Assessment is a certain percentage of the fair market value that is determined by local assessors to be the total taxable value of land and additions on the property. | Land | Improvement |
|---|---|---|---|---|
| 2025 | $7,314 | $256,900 | $66,500 | $190,400 |
| 2024 | $7,024 | $256,900 | $66,500 | $190,400 |
| 2023 | $6,460 | $195,650 | $66,500 | $129,150 |
| 2022 | $6,321 | $195,650 | $66,500 | $129,150 |
| 2021 | $6,384 | $195,650 | $66,500 | $129,150 |
| 2020 | $6,325 | $195,650 | $66,500 | $129,150 |
| 2019 | $6,251 | $195,650 | $66,500 | $129,150 |
| 2018 | $6,133 | $189,770 | $66,500 | $123,270 |
| 2017 | $5,925 | $189,770 | $66,500 | $123,270 |
| 2016 | $5,906 | $189,770 | $66,500 | $123,270 |
| 2015 | $5,606 | $189,770 | $66,500 | $123,270 |
| 2014 | $5,443 | $189,770 | $66,500 | $123,270 |
Source: Public Records
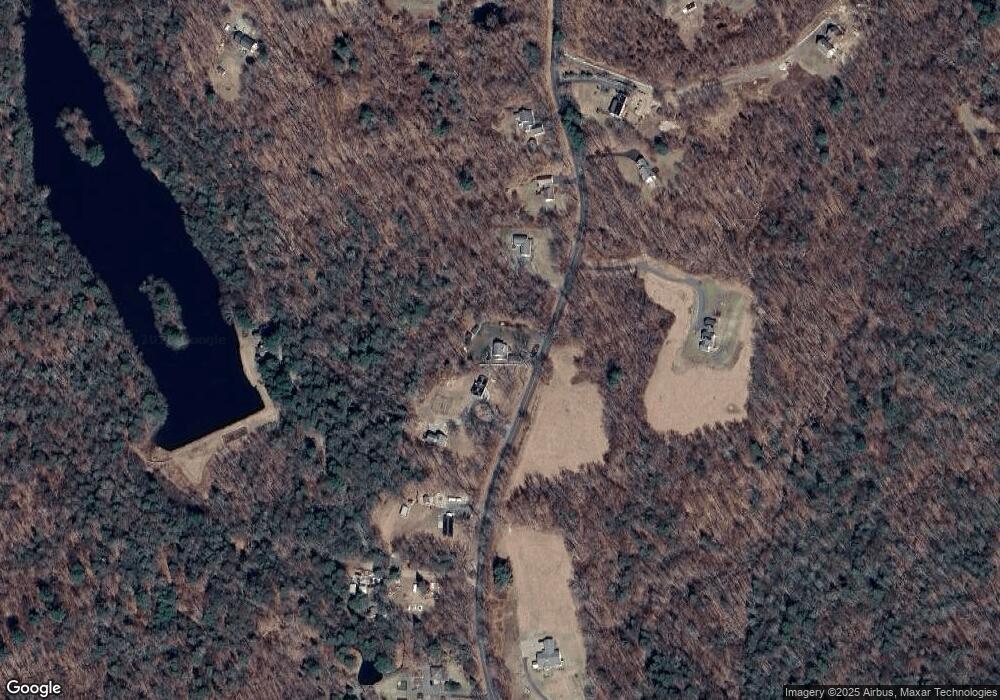
Map
Nearby Homes
- 408 A Niles Rd
- 37 Maillet Ln
- 555 Town Hill Rd
- 18 Niles Rd
- 595 Town Hill Rd
- 22B Hoppen Rd
- 57 Henderson Rd
- 22A Hoppen Rd
- 230 White Oak Way
- 229 White Oak Way
- 225 White Oak Way
- 109 Winterberry Way
- 86 Bsullak Rd
- 71 Wickett St
- 3222 Torringford St
- 45 Eddy Rd
- 7 Church St N
- 200 W Hill Rd
- 537 Main St
- 35 White Pine Rd