381 Bushy Head Ln Cherry Log, GA 30522
Estimated Value: $463,280 - $649,000
Studio
1
Bath
2,054
Sq Ft
$273/Sq Ft
Est. Value
About This Home
This home is located at 381 Bushy Head Ln, Cherry Log, GA 30522 and is currently estimated at $560,320, approximately $272 per square foot. 381 Bushy Head Ln is a home with nearby schools including Fannin County High School.
Ownership History
Date
Name
Owned For
Owner Type
Purchase Details
Closed on
Dec 21, 2020
Sold by
Friel Alan L
Bought by
Friel Alan L and Friel Kebin Frederick
Current Estimated Value
Home Financials for this Owner
Home Financials are based on the most recent Mortgage that was taken out on this home.
Original Mortgage
$250,000
Outstanding Balance
$178,907
Interest Rate
2.7%
Mortgage Type
New Conventional
Estimated Equity
$381,413
Purchase Details
Closed on
May 13, 2013
Sold by
Simpson Ronald C
Bought by
Friel Alan L
Home Financials for this Owner
Home Financials are based on the most recent Mortgage that was taken out on this home.
Original Mortgage
$218,400
Interest Rate
3.44%
Mortgage Type
New Conventional
Purchase Details
Closed on
Jul 21, 2005
Sold by
Mcpherson Edward Jerry
Bought by
Simpson Ron
Purchase Details
Closed on
Nov 6, 1992
Bought by
Mcpherson Edward J
Purchase Details
Closed on
Mar 14, 1990
Bought by
U S Dept Of Justice
Create a Home Valuation Report for This Property
The Home Valuation Report is an in-depth analysis detailing your home's value as well as a comparison with similar homes in the area
Home Values in the Area
Average Home Value in this Area
Purchase History
| Date | Buyer | Sale Price | Title Company |
|---|---|---|---|
| Friel Alan L | -- | -- | |
| Friel Alan L | $274,500 | -- | |
| Simpson Ron | $147,500 | -- | |
| Mcpherson Edward J | -- | -- | |
| U S Dept Of Justice | -- | -- |
Source: Public Records
Mortgage History
| Date | Status | Borrower | Loan Amount |
|---|---|---|---|
| Open | Friel Alan L | $250,000 | |
| Previous Owner | Friel Alan L | $218,400 |
Source: Public Records
Tax History
| Year | Tax Paid | Tax Assessment Tax Assessment Total Assessment is a certain percentage of the fair market value that is determined by local assessors to be the total taxable value of land and additions on the property. | Land | Improvement |
|---|---|---|---|---|
| 2025 | $1,748 | $192,660 | $12,296 | $180,364 |
| 2024 | $16 | $176,323 | $12,296 | $164,027 |
| 2023 | $1,451 | $142,295 | $12,296 | $129,999 |
| 2022 | $1,467 | $143,912 | $12,296 | $131,616 |
| 2021 | $1,046 | $74,609 | $12,296 | $62,313 |
| 2020 | $1,063 | $74,609 | $12,296 | $62,313 |
| 2019 | $1,084 | $74,609 | $12,296 | $62,313 |
| 2018 | $1,149 | $74,609 | $12,296 | $62,313 |
| 2016 | $1,105 | $65,058 | $9,738 | $55,320 |
| 2015 | $1,275 | $71,840 | $9,738 | $62,102 |
| 2014 | $1,347 | $76,103 | $11,379 | $64,724 |
| 2013 | -- | $58,452 | $11,379 | $47,072 |
Source: Public Records
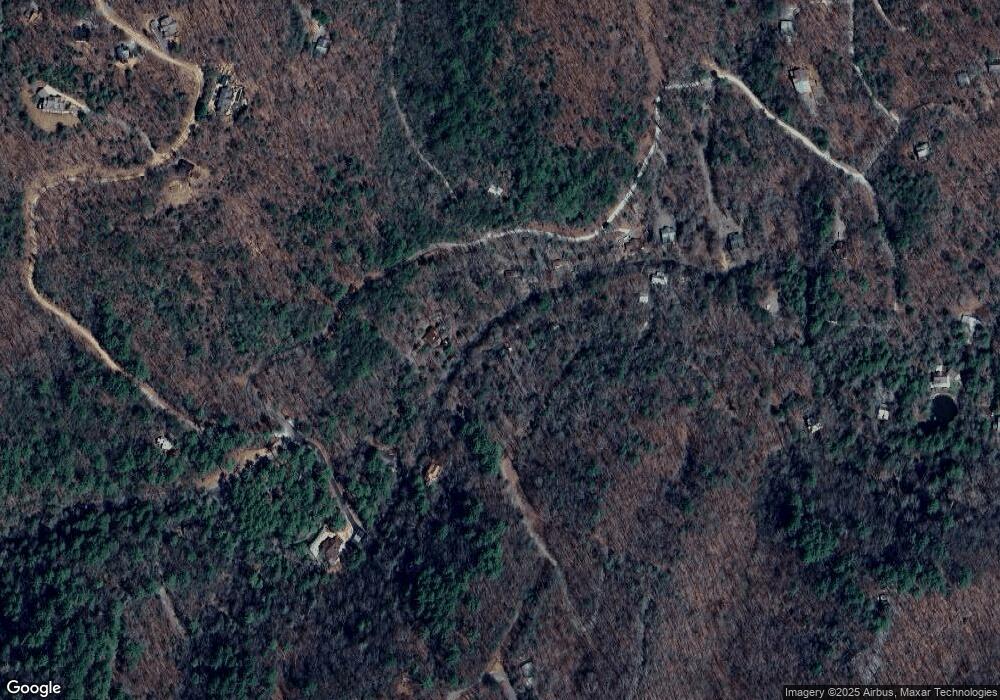
Map
Nearby Homes
- 476 Prince Mountain Rd
- 587 Lower Prince Mountain Rd
- 240 Lower Prince Mountain Rd
- 494 Lower Prince Mountain Rd
- 541 Mountain View Cir
- 161 Cub Trail
- 272 Heights Overlook
- 251 Rockhouse Rd
- 12 Heights Overlook
- 420 Olivers Trail
- 344 Cascade Ln
- 172 Sweetwater Rd
- 31 Highland Hammock Dr
- 30 Laurel Branch
- 78 Brass Hill Rd
- 70 Cascading Brook Ln
- 192 Bushy Head Rd
- 111 Laurel Crossing
- LOT 1 High Knee Rd
- 134 Hemlock Cir Unit 54
- 347 Bushy Head Ln
- 1194 Cashes Valley Ln
- 1292 Cashes Valley Ln
- 1426 Cashes Valley Ln
- 341 Bushy Head Ln
- 1080 Cashes Valley Ln
- 2.3AC Cashes Valley Ln
- Lot 10 Cashes Valley Ln Unit 10
- Lot 10 Cashes Valley Ln
- 1 & 2 Cashes Valley Ln
- 2 & 3 Cashes Valley Ln
- 2 ACR Cashes Valley Ln
- TR 16 Cashes Valley Ln
- 15 Cashes Valley Ln
- 14 Cashes Valley Ln
- 1364 Cashes Valley Ln
- 1426 Cashes Valley Ln
- 1000 Cashes Valley Ln
- 0 Cashes Valley Ln Unit 261652
- 0 Cashes Valley Ln Unit 2.3AC 7445856
Your Personal Tour Guide
Ask me questions while you tour the home.