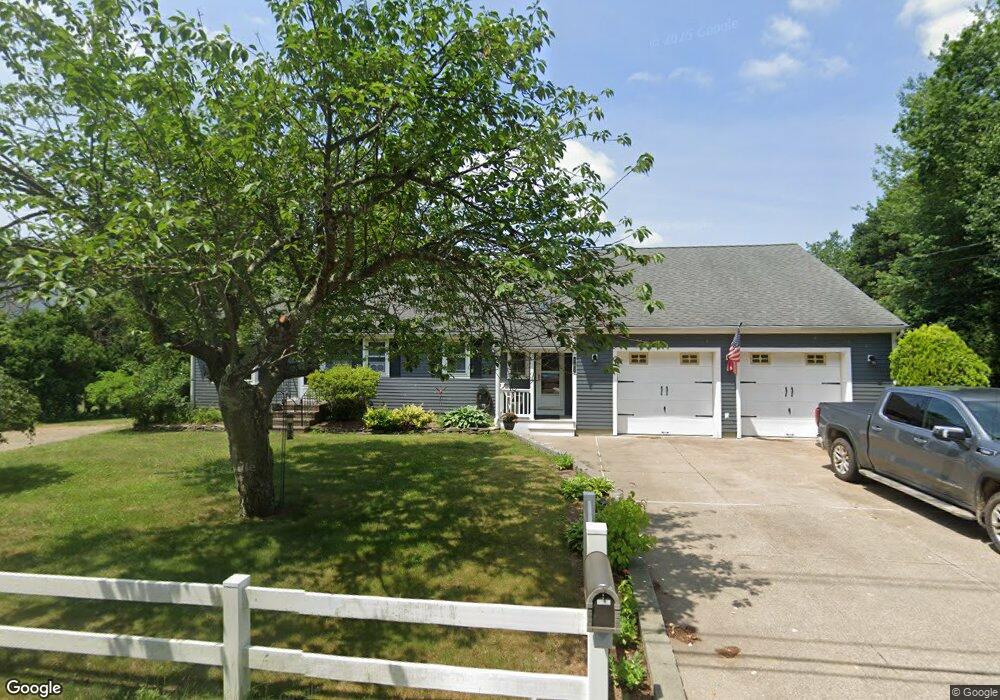
381 Conant St Bridgewater, MA 02324
Estimated Value: $533,000 - $700,000
4
Beds
2
Baths
1,716
Sq Ft
$362/Sq Ft
Est. Value
About This Home
This home is located at 381 Conant St, Bridgewater, MA 02324 and is currently estimated at $620,719, approximately $361 per square foot. 381 Conant St is a home located in Plymouth County with nearby schools including Mitchell Elementary School, Williams Intermediate School, and Bridgewater Middle School.
Ownership History
Date
Name
Owned For
Owner Type
Purchase Details
Closed on
Oct 24, 2008
Sold by
Barclays Capital Re
Bought by
Soderbom James H
Current Estimated Value
Home Financials for this Owner
Home Financials are based on the most recent Mortgage that was taken out on this home.
Original Mortgage
$248,490
Interest Rate
5.94%
Mortgage Type
Purchase Money Mortgage
Purchase Details
Closed on
May 21, 2008
Sold by
Oliviera-Dutra Margareth
Bought by
Wells Fargo Bk
Purchase Details
Closed on
Mar 31, 2005
Sold by
Cormo Joyce A
Bought by
Dutra Margareth Olive
Purchase Details
Closed on
Aug 27, 1991
Sold by
Elder Michelle Y and Elder George J
Bought by
Eppy Rt
Create a Home Valuation Report for This Property
The Home Valuation Report is an in-depth analysis detailing your home's value as well as a comparison with similar homes in the area
Home Values in the Area
Average Home Value in this Area
Purchase History
| Date | Buyer | Sale Price | Title Company |
|---|---|---|---|
| Soderbom James H | $276,100 | -- | |
| Wells Fargo Bk | $215,000 | -- | |
| Dutra Margareth Olive | $440,000 | -- | |
| Eppy Rt | $136,000 | -- |
Source: Public Records
Mortgage History
| Date | Status | Borrower | Loan Amount |
|---|---|---|---|
| Open | Eppy Rt | $248,000 | |
| Closed | Eppy Rt | $248,490 |
Source: Public Records
Tax History
| Year | Tax Paid | Tax Assessment Tax Assessment Total Assessment is a certain percentage of the fair market value that is determined by local assessors to be the total taxable value of land and additions on the property. | Land | Improvement |
|---|---|---|---|---|
| 2025 | $6,490 | $548,600 | $208,200 | $340,400 |
| 2024 | $6,309 | $519,700 | $198,300 | $321,400 |
| 2023 | $6,366 | $495,800 | $185,300 | $310,500 |
| 2022 | $6,291 | $439,300 | $162,600 | $276,700 |
| 2021 | $5,736 | $396,100 | $145,200 | $250,900 |
| 2020 | $8,258 | $384,200 | $139,600 | $244,600 |
| 2019 | $8,066 | $373,100 | $139,600 | $233,500 |
| 2018 | $5,307 | $349,400 | $129,100 | $220,300 |
| 2017 | $5,098 | $326,600 | $129,100 | $197,500 |
| 2016 | $4,881 | $314,100 | $126,600 | $187,500 |
| 2015 | $4,914 | $302,600 | $122,900 | $179,700 |
| 2014 | $4,812 | $296,100 | $119,300 | $176,800 |
Source: Public Records
Map
Nearby Homes
- 1 Anacki Ln Unit 24
- 35 Nelson Dr
- 0 Flagg St Unit 73421818
- 1 Jennifer Cir
- 220 Bedford St Unit 32
- 120 Worcester St
- 51 Cottage St
- 35 Stockbridge Rd
- 44 Titicut Ave Unit Lot 45
- 46 Titicut Ave
- 101 Pratt Ave
- 73 Pratt Ave
- 17 Forbes Rd Unit Lot 64
- 0 Bedford St Unit 73480500
- 30 Sanger St
- 118 Plesant St
- 167 Spring St
- 47 Hale St
- 302 Pleasant St
- 8 North St
Your Personal Tour Guide
Ask me questions while you tour the home.