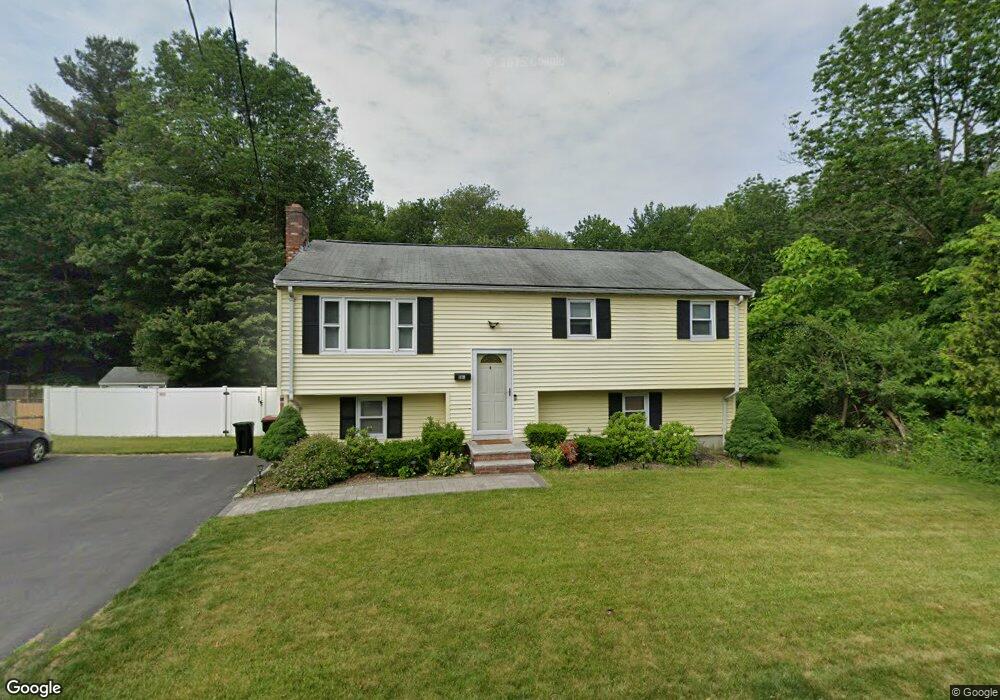
381 East St Brockton, MA 02302
Estimated Value: $455,000 - $523,000
5
Beds
1
Bath
988
Sq Ft
$511/Sq Ft
Est. Value
About This Home
This home is located at 381 East St, Brockton, MA 02302 and is currently estimated at $504,722, approximately $510 per square foot. 381 East St is a home located in Plymouth County with nearby schools including Davis K-8 School, John F. Kennedy Elementary School, and South Middle School.
Ownership History
Date
Name
Owned For
Owner Type
Purchase Details
Closed on
Oct 21, 2002
Sold by
Andrade Gilda and Andrade Jose
Bought by
Ryan Stanley M and Ryan Rochelle
Current Estimated Value
Home Financials for this Owner
Home Financials are based on the most recent Mortgage that was taken out on this home.
Original Mortgage
$256,054
Outstanding Balance
$107,505
Interest Rate
6.18%
Mortgage Type
Purchase Money Mortgage
Estimated Equity
$397,217
Purchase Details
Closed on
May 22, 1992
Sold by
Rowe Greta V Est
Bought by
Andrade Jose M
Create a Home Valuation Report for This Property
The Home Valuation Report is an in-depth analysis detailing your home's value as well as a comparison with similar homes in the area
Home Values in the Area
Average Home Value in this Area
Purchase History
| Date | Buyer | Sale Price | Title Company |
|---|---|---|---|
| Ryan Stanley M | $259,900 | -- | |
| Andrade Jose M | $79,900 | -- |
Source: Public Records
Mortgage History
| Date | Status | Borrower | Loan Amount |
|---|---|---|---|
| Open | Andrade Jose M | $256,054 | |
| Previous Owner | Andrade Jose M | $110,000 | |
| Previous Owner | Andrade Jose M | $55,000 |
Source: Public Records
Tax History Compared to Growth
Tax History
| Year | Tax Paid | Tax Assessment Tax Assessment Total Assessment is a certain percentage of the fair market value that is determined by local assessors to be the total taxable value of land and additions on the property. | Land | Improvement |
|---|---|---|---|---|
| 2025 | $5,391 | $445,200 | $157,800 | $287,400 |
| 2024 | $5,258 | $437,400 | $157,800 | $279,600 |
| 2023 | $5,182 | $399,200 | $107,900 | $291,300 |
| 2022 | $4,642 | $332,300 | $98,100 | $234,200 |
| 2021 | $4,470 | $308,300 | $90,300 | $218,000 |
| 2020 | $4,351 | $287,200 | $79,500 | $207,700 |
| 2019 | $4,272 | $274,900 | $75,600 | $199,300 |
| 2018 | $4,201 | $261,600 | $75,600 | $186,000 |
| 2017 | $3,664 | $227,600 | $75,600 | $152,000 |
| 2016 | $3,547 | $204,300 | $72,100 | $132,200 |
| 2015 | $3,158 | $174,000 | $72,100 | $101,900 |
| 2014 | $3,030 | $167,100 | $72,100 | $95,000 |
Source: Public Records
Map
Nearby Homes