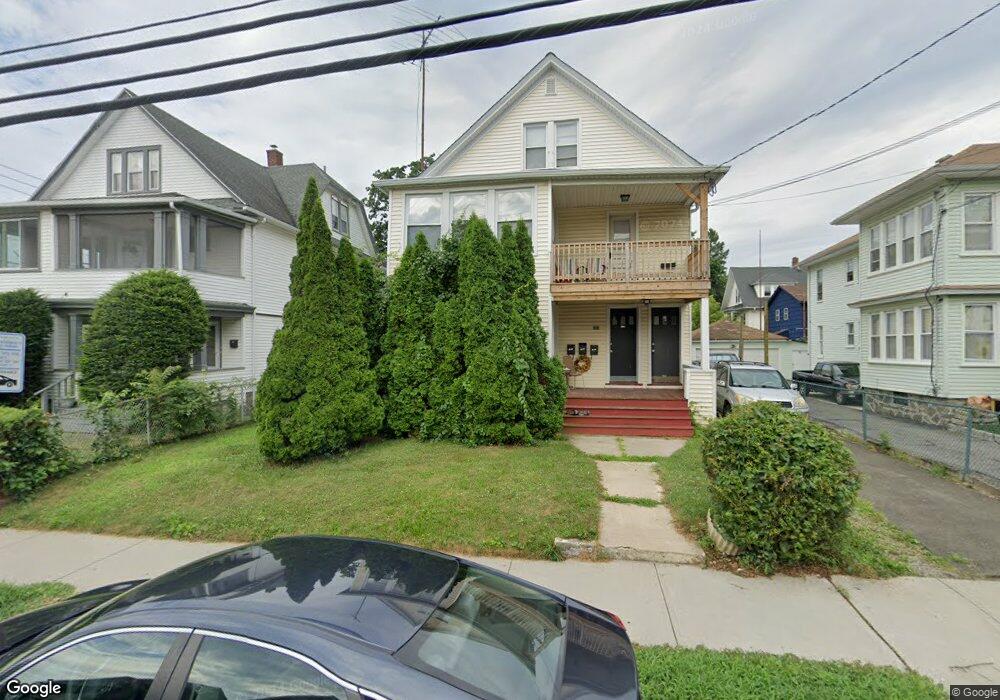
381 Ellsworth St Unit 383 Bridgeport, CT 06605
Black Rock NeighborhoodEstimated Value: $543,386 - $871,000
6
Beds
3
Baths
3,325
Sq Ft
$208/Sq Ft
Est. Value
About This Home
This home is located at 381 Ellsworth St Unit 383, Bridgeport, CT 06605 and is currently estimated at $691,597, approximately $207 per square foot. 381 Ellsworth St Unit 383 is a home located in Fairfield County with nearby schools including Black Rock School, Bassick High School, and Great Oaks Charter School Bridgeport.
Ownership History
Date
Name
Owned For
Owner Type
Purchase Details
Closed on
Feb 3, 2010
Sold by
Lucien Investors Llc
Bought by
Torriaos Javier J
Current Estimated Value
Home Financials for this Owner
Home Financials are based on the most recent Mortgage that was taken out on this home.
Original Mortgage
$225,000
Outstanding Balance
$149,061
Interest Rate
5.05%
Estimated Equity
$542,536
Purchase Details
Closed on
Nov 12, 2009
Sold by
Deutsche Bank Natl T C
Bought by
Lucien Investors Llc
Purchase Details
Closed on
Aug 11, 2009
Sold by
Melgar Victor M
Bought by
Deutsche Bank Natl T C
Purchase Details
Closed on
Oct 19, 2004
Sold by
Rodrigues Santiage
Bought by
Melgak Victor
Purchase Details
Closed on
Aug 28, 2001
Sold by
Happ Alice K Est
Bought by
Rodriguez Santiago
Create a Home Valuation Report for This Property
The Home Valuation Report is an in-depth analysis detailing your home's value as well as a comparison with similar homes in the area
Home Values in the Area
Average Home Value in this Area
Purchase History
| Date | Buyer | Sale Price | Title Company |
|---|---|---|---|
| Torriaos Javier J | $300,000 | -- | |
| Torriaos Javier J | $300,000 | -- | |
| Lucien Investors Llc | $160,000 | -- | |
| Lucien Investors Llc | $160,000 | -- | |
| Deutsche Bank Natl T C | -- | -- | |
| Deutsche Bank Natl T C | -- | -- | |
| Melgak Victor | $399,000 | -- | |
| Melgak Victor | $399,000 | -- | |
| Rodriguez Santiago | $197,250 | -- | |
| Rodriguez Santiago | $197,250 | -- |
Source: Public Records
Mortgage History
| Date | Status | Borrower | Loan Amount |
|---|---|---|---|
| Open | Rodriguez Santiago | $225,000 | |
| Closed | Rodriguez Santiago | $225,000 |
Source: Public Records
Tax History Compared to Growth
Tax History
| Year | Tax Paid | Tax Assessment Tax Assessment Total Assessment is a certain percentage of the fair market value that is determined by local assessors to be the total taxable value of land and additions on the property. | Land | Improvement |
|---|---|---|---|---|
| 2025 | $13,144 | $302,513 | $141,203 | $161,310 |
| 2024 | $13,144 | $302,513 | $141,203 | $161,310 |
| 2023 | $13,144 | $302,513 | $141,203 | $161,310 |
| 2022 | $13,144 | $302,513 | $141,203 | $161,310 |
| 2021 | $13,144 | $302,513 | $141,203 | $161,310 |
| 2020 | $11,289 | $209,090 | $83,800 | $125,290 |
| 2019 | $11,289 | $209,090 | $83,800 | $125,290 |
| 2018 | $11,368 | $209,090 | $83,800 | $125,290 |
| 2017 | $11,368 | $209,090 | $83,800 | $125,290 |
| 2016 | $11,368 | $209,090 | $83,800 | $125,290 |
| 2015 | $10,136 | $240,190 | $79,780 | $160,410 |
| 2014 | $10,136 | $240,190 | $79,780 | $160,410 |
Source: Public Records
Map
Nearby Homes
- 26 Rowsley St Unit 3
- 185 Shell St
- 222 Ellsworth St
- 20 Haddon St Unit 5
- 20 Haddon St Unit 3
- 2773 Fairfield Ave Unit 3
- 51 Princeton St
- 105 Scofield Ave
- 167 Scofield Ave
- 166 Alfred St
- 82 Waldorf Ave
- 39 Jetland Place Unit 41
- 328 Brewster St
- 855 Brewster St Unit 857
- 135 Whittier St
- 165 Bennett St
- 144 Whittier St
- 105 Fox St Unit 107
- 450 Davidson St
- 621 Courtland Ave
- 381 Ellsworth St Unit 1 FL
- 381 Ellsworth St Unit 3 FLO
- 375 Ellsworth St
- 391 Ellsworth St Unit 393
- 26 Melrose Ave Unit 28
- 373 Ellsworth St Unit 375
- 373 Ellsworth St Unit 3
- 386 Ellsworth St
- 386 Ellsworth St Unit 1
- 376 Ellsworth St Unit 378
- 376 Ellsworth St Unit 1
- 29 Circular Ave Unit 31
- 34 Melrose Ave
- 401 Ellsworth St Unit 403
- 39 Circular Ave Unit 45
- 33-35 Circular Ave
- 33 Circular Ave Unit 35
- 33 Circular Ave Unit 3
- 33 Circular Ave Unit 2nd
- 33 Circular Ave Unit 2